Urban Growth and Heat in Tropical Climates
 Peter J. Marcotullio
 Carsten Keßler
 Rebeca Quintero Gonzalez3
 - 1Department of Geography and Environmental Science, Hunter College, Institute for Sustainable Cities, City University of New York (CUNY), New York, NY, United States
- 2Department of Geodesy, Bochum University of Applied Sciences, Bochum, Germany
- 3Department of Planning, Technical Faculty of IT and Design, Aalborg University Copenhagen, Copenhagen, Denmark
- 4Department of Public Health, California State University, East Bay, Hayward, CA, United States
This research describes the change in temperatures across approximately 270 tropical cities from 1960 to 2020 with a focus on urban warming. It associates urban growth indicators with temperature variations in tropical climate zones (tropical rainforest, tropical monsoon, and tropical wet-dry savanna). Our findings demonstrate that over time while temperatures have increased across the tropics, urban residents have experienced higher temperatures (minimum and maximum) than those living outside of cities. Moreover, in certain tropical zones, over the study period, temperatures have risen faster in urban areas than the background (non-urban) temperatures. The results also suggest that with continuing climate change and urban growth, temperatures will continue to rise at higher than background levels in tropical cities unless mitigation measures are implemented. Several fundamental characteristics of urban growth including population size, population density, infrastructure and urban land use patterns are factors associated with variations in temperatures. We find evidence that dense urban forms (compact residential and industrial developments) are associated with higher temperatures and population density is a better predictor of variation in temperatures than either urban population size or infrastructure in most tropic climate zones. Infrastructure, however, is a better predictor of temperature increases in wet-dry savanna tropical climates than population density. There are a number of potential mitigation measures available to urban managers to address heat. We focus on ecological services, but whether these services can address the projected increasing heat levels is unclear. More local research is necessary to untangle the various contributions to increasing heat in cities and evaluate whether these applications can be effective to cool tropical cities as temperature continue to rise. Our methods include combining several different datasets to identify differences in daily, seasonal, and annual maximum and minimum temperatures.
Introduction
Tropical climate zones, located between 23.5N and 23.5S latitudes, include many rapidly developing countries. For example, tropical climate zones are located in South America (i.e., Brazil, Ecuador, Colombia), Africa (i.e., Ghana, Nigeria, Benin, The Gambia), South Asia (i.e., India, Bangladesh) and East and Southeast Asia (i.e., Myanmar, Thailand, Philippines, Cambodia, Indonesia, Laos, and Vietnam). Like the rest of the world, tropical regions have seen continuous urbanization and the growth of cities for the last decades (UN, 2018), with continued urban growth projected into the future (Jiang and O’Neill, 2017).
Simultaneously, climate change related temperature increases are affecting tropical areas (IPCC, 2014b). Recent work in South Asia and parts of Africa find increasing intensity and frequency of heatwaves (Sun et al., 2014; Ceccherini et al., 2017). Projections point to large numbers of urban residents exposed to very warm heat conditions, under business-as-usual conditions (Mora et al., 2017; Rohat et al., 2020; Marcotullio et al., 2021). Moreover, the IPCC projects for the 21st century that the strongest warming will be experienced by tropical regions (IPCC, 2014b). There is also high confidence that the number of hot days is projected to increase in most land regions, with highest increases expected in the tropics (IPCC, 2019).
We examine the historical relationship between urbanization, urban growth, climate change, and urban warming in tropical areas and specifically changes in temperature characteristics in tropical rainforest, monsoonal and wet-dry savanna tropical zones across time for urban and non-urban areas. We attempt to separate climate change related warming from warming specific to cities. We also examine which proxy for anthropogenic activity is the best predictor of temperature variations across and within cities. Finally, we point to the potential use of ecosystem services to mitigate heat. As our research is at the global scale, we can only identify the potential opportunities and challenges for using ecosystem services to address heat. Nevertheless, the research provides relevant information for policy makers in tropical cities for addressing current and future urban conditions.
This is a first analysis of urban warming for tropical cities at this scale (including cities from different continents). We examine temperature changes across approximately 270 urban areas. While studies have examined urban and climate change temperature related increases within case study tropical cities, this is one of the first comparative studies to estimate changes across cities for different tropical climate zones (rainforest, monsoon and wet-dry savanna). We present an analysis of indicators that predict changes in temperature across cities. Generally, despite the possible sources of warming, researchers often use population size as a proxy for all these different factors. While the trends of increasing population, population density and infrastructure are similar, there are differences in their associations with temperature change. Moreover, the findings point to urban form as an important contributing factor in urban warming. This suggests that the use of ecosystems services (i.e., increased greening), can be a mitigation tool, although the effectiveness of this solution will vary among urban areas.
The next section of this paper presents background on tropical zones and contemporary urbanization and urban growth in these locations. We also review the theoretical literature on urban warming as is related to climate change and urban heat island (UHI). The third section describes the data and methods for the project. The fourth section presents the results of our analyses. In the fifth section, we discuss the findings, their implications for tropical cities and the potential use of ecosystem services to address heat. In the final section we conclude and summarize our study.
Background
Tropical Zones and a Changing Climate
The Köppen-Geiger climate zone classification system is based upon local vegetation, which is highly dependent on key components of climate, temperature and precipitation. The system was first devised in the 19th century and subsequently updated. There are currently five climate zones (tropical, arid, temperate, continental and polar) and some 30 sub-divisions. This study focuses on the tropical climates, which are characterized by monthly average temperatures of 18°C or higher year-round with small annual ranges. Annual precipitation is abundant and shows a seasonal rhythm to varying degrees. Sunlight is intense. The tropics have abundant plant life that grows throughout the year. Approximately 14 of the world’s 34 biodiversity hotspots (Habel et al., 2019) and 50% of all known plant species are in tropical zones (Primack and Morrison, 2013).
Tropical climates are not homogenous. They are further subdivided into three zones: tropical rainforests, which have no dry season, monsoonal zones, which have a short dry season, and seasonal wet-dry savanna zones, which have alternating wet and dry seasons (Beck et al., 2018). These climates make up a significant part of Earth’s terrestrial surface. According to the Global Forest Atlas1 tropical forests represent 31% (17 million km2) of global ice-free land surface area. Tropical dry forests make up 4% (6 million km2) and tropical savannas occupy 15% (20 million km2) of Earth’s ice-free land cover.
Given high endemism and species richness, the type of settlement development across the tropics is of particular interest. Current regional rapid economic growth and urbanization is exerting high deforestation pressures and subsequent loss of biodiversity (Hansen et al., 2013). Tropical areas have undergone extensive land cover change largely related to agriculture expansion and urbanization dynamics (Lambin et al., 2003). These land use changes also have interrelated impacts on climate (Tolle et al., 2017).
Climate analysts suggest that the tropics are particularly vulnerable to climate change (IPCC, 2014a). For example, recent studies suggest the number of high temperature events have increased around the world (Rahmstorf and Coumou, 2011; Sun et al., 2014; Christidis et al., 2015). In the tropics, heat waves are increasing in intensity and frequency (Ceccherini et al., 2017) and with increasing climate change, tropical regions are projected to experience significant increases in extreme heat events (Russo et al., 2014; Harrington et al., 2016; Nikulin et al., 2018; Russo et al., 2019). Climate related heat affects cities (Mishra et al., 2015; Matthews et al., 2017) and is expected to bring high heat exposure to increasing numbers of residents in the future (Mora et al., 2017; Rohat et al., 2020; Marcotullio et al., 2021). Addressing climate change heat is all the more urgent as many countries in the tropical regions have low incomes and as such, have limited capacity to adapt (World Bank, 2017, 2018).
Urbanization and Urban Growth Trends in the Tropics
There are at least 106 countries with tropical zones within their borders. The total populations of the countries with more than 15% of their land area classified as tropical accounted for approximately 48% (3.5 billion) of the total world population in 2015. The UN projects (medium variant) that by 2050, this population will increase to 54% (5.3 billion) of world population and by 2100, the population in these countries are projected to account for over 59% of world population (6.6 billion) (UN, 2017).
In 2015, the urban population share of countries with 15% of land classified as tropical zones reached 39% (1.5 billion) of the total global urban population. The UN projects that by 2050 these numbers will increase dramatically and account for 48% (3.2 billion) of the total global urban population (UN, 2018). These figures suggest that tropical countries are currently undergoing rapid urbanization. A recent review of urban expansion from 1979 to 2010 suggests small and medium sized cities in the tropics are both expanding in land area and becoming less dense (Güneralp et al., 2020). These researchers also find that for Latin America, India and Southeast Asia, large cities are also undergoing “sprawl” type development. As more people move to cities in the tropics and urban land use growth trends continue, urban warming is projected to increase (Huang et al., 2019; Manoli et al., 2019).
Urban Growth and Heat
Elevated temperatures in the urban environment are described in various ways. Three different, but related concepts include extreme heat or heat waves, urban heat island effect and urban warming. Studies often characterize heat events of high ambient temperatures, as heat waves. Despite common usage, however, scientists have no common empirical definition or standard measure of a heat wave (Perkins, 2015; Horton et al., 2016; Dosio et al., 2018). Qualitatively, heat waves are observed high temperature extremes that occur over consecutive days (Alexander et al., 2006; Della-Marta et al., 2007). Heat wave characteristics (e.g., intensity, frequency, and duration) and their impacts vary by geographic scale and region (Perkins et al., 2012). As a result, definitions vary substantially across countries and localities, as each country determines thresholds and indices in accordance with the local climate and population vulnerability (Nissan et al., 2017).
In cities, rising temperatures and heat waves are exacerbated by the higher temperatures in the core as compared to surrounding areas. This is called the UHI effect, which provides a clear example of anthropogenic impacts on climate. Urban heat island has been known for centuries (Howard, 1818) and has subsequently been identified in cities around the world (Kataoka et al., 2009). Urban climate analysts consider UHI one of the major environmental problems of the twenty-first century (Arnfield, 2003; McKendry, 2003; Rizwan et al., 2008). In recent years, four different types of UHI have been defined, including subsurface UHI, surface UHI, canopy layer UHI and boundary layer UHI. All these different UHIs relate to differences between the urban and rural temperatures, but each is measured differently.
The canopy UHI is measured between the surface and the tree canopy or below the average building height of the city and is of most interest to this study. All urban settlements demonstrate the canopy UHI “cliff, plateau, hill, valley and peak” pattern in cross section with rural areas despite differences in macroclimate and culture (Oke et al., 2017). The UHI pattern in smaller cities resembles miniature versions of large cities. Mega-cities demonstrate more extreme distinctions. In general, canopy UHI values are typically around 3–4°C (Voogt, 2002; Oke et al., 2017), but can vary between 0.4 and 12°C (Santamouris, 2015) and reach 17°C in inner-city hot spots (Makrogiannis et al., 1998). In many cases, the highest canopy UHI occurs during the summer or warmer seasons (Makrogiannis et al., 1998; Wang and Hu, 2006; Erell and Williamson, 2007), although in some cities canopy UHI is highest during the winter or cooler months (Hinkel et al., 2003; Salvati et al., 2017). Maximum canopy UHI intensities are typically experienced during the early evenings (Arnfield, 2003). Canopy UHI does not affect maximum temperatures as much as minimum and mean temperatures within urban areas.
Urban warming is closely related to UHI, except that urban warming studies typically examine the role of urbanization and urban growth to local, regional, or global climate change over long time periods. As Grimmond (2007) points out, the magnitude of urban warming is highly variable over time and space and therefore needs to be explored in this context. Early urban warming studies suggest very minor contributions of urbanization and urban growth to regional or global climate change. For example, a study by Jones et al. (1990) on urbanization and related temperature variation indicates that the impact of urbanization on the mean surface temperature would be no more than 0.05°C per 100 years. Recent studies suggest much more significant contributions. For example, Sun et al. (2016) find that for China from 1961 to 2013, urban warming influences account for about a third of observed warming, 0.49°C (0.12–0.86°C) for the country. The debate over the contribution of cities to global warming is not resolved. Recent research on China’s urban warming suggests that urban warming studies can over-estimate impacts (Wang and Yan, 2016).
Notwithstanding these debates, scholars generally agree on the major factors creating urban heat islands and subsequent urban warming increases. Canopy UHI is controlled by air temperature modifiers at the local level including, inter alia, street geometry, building fabric and anthropogenic activity (i.e., vehicle traffic and space heating/cooling), as well as the soil moisture and vegetation. Urban climatologists characterize the physical aspects of canopy UHI in two important indices: the canyon aspect ratio (the ratio of the height to width of buildings) and the sky view factor (a dimensionless value defined by the ratio of the radiation received by a surface to the radiation emitted by the surface to the atmosphere affected by the proportion of the visible sky or open canyon space in urban streets). Typically, lower sky view values and higher canyon aspect ratios are associated with higher UHI intensities. The unique nature of built forms and surrounding areas and the variety of urban functions may help to explain the variety of UHI intensity results.
Initially, scholars have demonstrated that the absolute values of canopy UHI in a city relate to the size of a city, measured in population size, city area or diameter (Oke, 1973; Roth, 2007; Santamouris, 2015). Recently studies have also demonstrated the importance of population density and urban design on urban heat. A study of Nagpur, India, that examined changes in maximum and minimum temperatures during the summer and winter seasons finds that the highest nocturnal mean air temperature occurs in areas with high building density, high population density, and little green cover. The minimum mean nocturnal air temperature was observed in areas with lower building density and lower population density and more vegetation (Kotharkar and Surawar, 2016). In Bogotaá, Colombia, a similar study demonstrates that population densities above 14,500 inhabitants/km2 may cause air temperature increases of more than 1°C compared to other areas. These researchers conclude that urban form, expressed by land cover and urban morphology changes, caused by population density, have an effect on urban temperatures (Ramiìrez-Aguilar and Souza, 2019).
Infrastructure also plays a role in impacting urban heat. Constructed surfaces are more likely to increase temperature than natural surfaces (Changnon, 1992), as urban green spaces can reduce UHI effects (Debbage and Shepherd, 2015). A recent study of Delhi through remotely sensed surface temperature UHI focused on identifying these claims. This study demonstrates an increase in surface temperature with an increase in impervious surface area (Mallick and Rahman, 2012). Built environment characteristics, such as impervious surface area, building area density, building height and road density, are important factors in both surface temperature and air temperature differences between urban and rural locations (Pigeon et al., 2007; Oke et al., 2017).
The differences that green areas make in urban heat reduction are evident in ambient temperature differences across different urban form patterns within cities. Local climate zones (LCZs) are a good way to standardize intra-urban development patterns and examine intra-urban climate differences, including temperature (Bechtel et al., 2019). Local climate zones distinguish between compact, open, and more sparsely built high-rise, mid-rise and low-rise developments in cities, as a type of urban land use categorization. They also include industrial and various types of vegetative categories (Stewart and Oke, 2012). A study of Eastern European cities finds that the highest surface UHI intensities occur in densely built-up LCZs without greenery and the lowest in sparsely built city outskirts with high levels of green areas (Geletiča et al., 2019).
Heat Reduction Through Ecosystem Services
There is a wide set of strategies to address heat in cities. Harlan and Ruddell (2011) divide these actions into advisory and prevention, building materials and design, land use change, transportation systems and innovation and experimentation. Importantly, however, building and land use development decisions have long-lasting effects due to the longevity of infrastructure and the path dependency that the physical project creates. For example, once a plot is developed as a residential or commercial building, industrial plant or hospital, it will potentially remain for several decades attracting similar developments.
Often overlooked in the building and land use development process, however, are the benefits of vegetation and natural systems removed by these structures. Ecosystem services, sometimes called blue-green infrastructure, include the goods and services provided by natural environments (e.g., vegetation and water), which have multiple benefits for human well-being (McGranahan et al., 2005). For example, greening and urban vegetation can provide heat, water and air regulation and ecosystem goods such as community garden products, all of which provide comfort, health, nutrition, recreation, and aesthetic benefits (Santamouris et al., 2020). Recent studies in northern cities continue to point to the importance of greenery and cool materials to reduce heat (Stone et al., 2019).
Ecosystem services can be integrated into urban design (e.g., on building walls, rooftops, roads, empty lots, waterways) and provide benefits alongside of anthropogenic infrastructure. A study in Colombo, Sri Lanka assessed “green walls,” vegetation alongside buildings, versus bare wall man-made structures. The researchers found that there was a 1.6–1.7°C reduction in temperature around buildings with green walls. A reduction in temperature outside a building will also greatly reduce the temperature inside a building as well (Galagoda et al., 2018). Studies from North America and Europe have also shown that by increasing vegetative cover and reducing impervious paved surfaces can reduce surface temperatures by as much as 10°C (Hamstead et al., 2016; Venter et al., 2020). In New York City, researchers demonstrate that neighborhood level mortality rates of older adults (65 + years) on days exceeding 38°C was positively associated with increased impervious surface cover, indicating that unvegetated surfaces likely increase the risk of heat-related mortality for populations in these areas (Rosenthal et al., 2014). While less studied than green infrastructure, blue infrastructure, including decorative and recreational waters, also have mitigating effects on urban heat.
Materials and Methods
This project required the integration of a number of datasets and the analyses of each to: (1) identify trends in temperatures across time and within different tropical climates for urban and non-urban areas; (2) estimate the total and urban warming experienced in the topics during the study period; (3) estimate the importance of difference proxies for predicting urban temperatures through gradient analysis; and, (4) compare the temperatures across intra-urban patterns of land use. This section first presents the datasets used and how they were managed. The second sub-section presents the steps in each analysis.
Data and Preparation
The project required a number of different spatial and non-spatial datasets that were integrated to provide a picture of the temperature change (maximum and minimum) in tropical cities and the factors associated with this change. Importantly, the project includes boundary definitions of urban areas along with continuous variables to define variations in “urbanness” (i.e., gradient analysis).
Climate and Temperature
We obtained temperature data from the National Oceanic and Atmospheric Association’s (NOAA) Global Historical Climatology Network’s (GHCN) Daily database. This is an integrated database of daily climate summaries subjected to a common suite of quality assurance reviews. GHCN-Daily contains records from over 107,000 stations in 180 countries and territories (Menne et al., 2012b). We used the most current version (v3) of the dataset (Menne et al., 2012a). From these daily data we extracted maximum and minimum temperature, elevation, country, and weather station ID, longitude, and latitude. The temperature database includes information from years back to the 1800s for some stations. We used data only from 1960 to 2020. In order to standardize the temperature data, we applied the adiabatic lapse rate to reduce all temperatures to sea level (Dodson and Marks, 1997). We removed outliers in daily temperatures by defining a threshold of 3 standard deviations from the period mean and rejecting those above the thresholds.
We used Köppen-Geiger classifications to identify tropical regions from the WorldClim 5 dataset (Version 1.4, release 3), data created by CliMond. The Köppen-Geiger classifications, following the rules defined in Kriticos et al. (2012), were applied to the 5′ resolution WorldClim global climatology2 [Version 1.4, release 3 (Hijmans et al., 2005)]. The climate data were overlaid on the GHCN-Daily database to help extract data from only tropical zones, including rainforest (Af), tropical wet-dry savanna regions (Aw) and tropical monsoonal zones (Am). This resulted in a sample of stations from over 106 countries (Figure 1). Not all stations, however, had temperature data during the study period. We extracted daily temperatures for the entire time period from 572 stations of which we calculated that 296 were in non-urban areas and 276 were in urban areas.
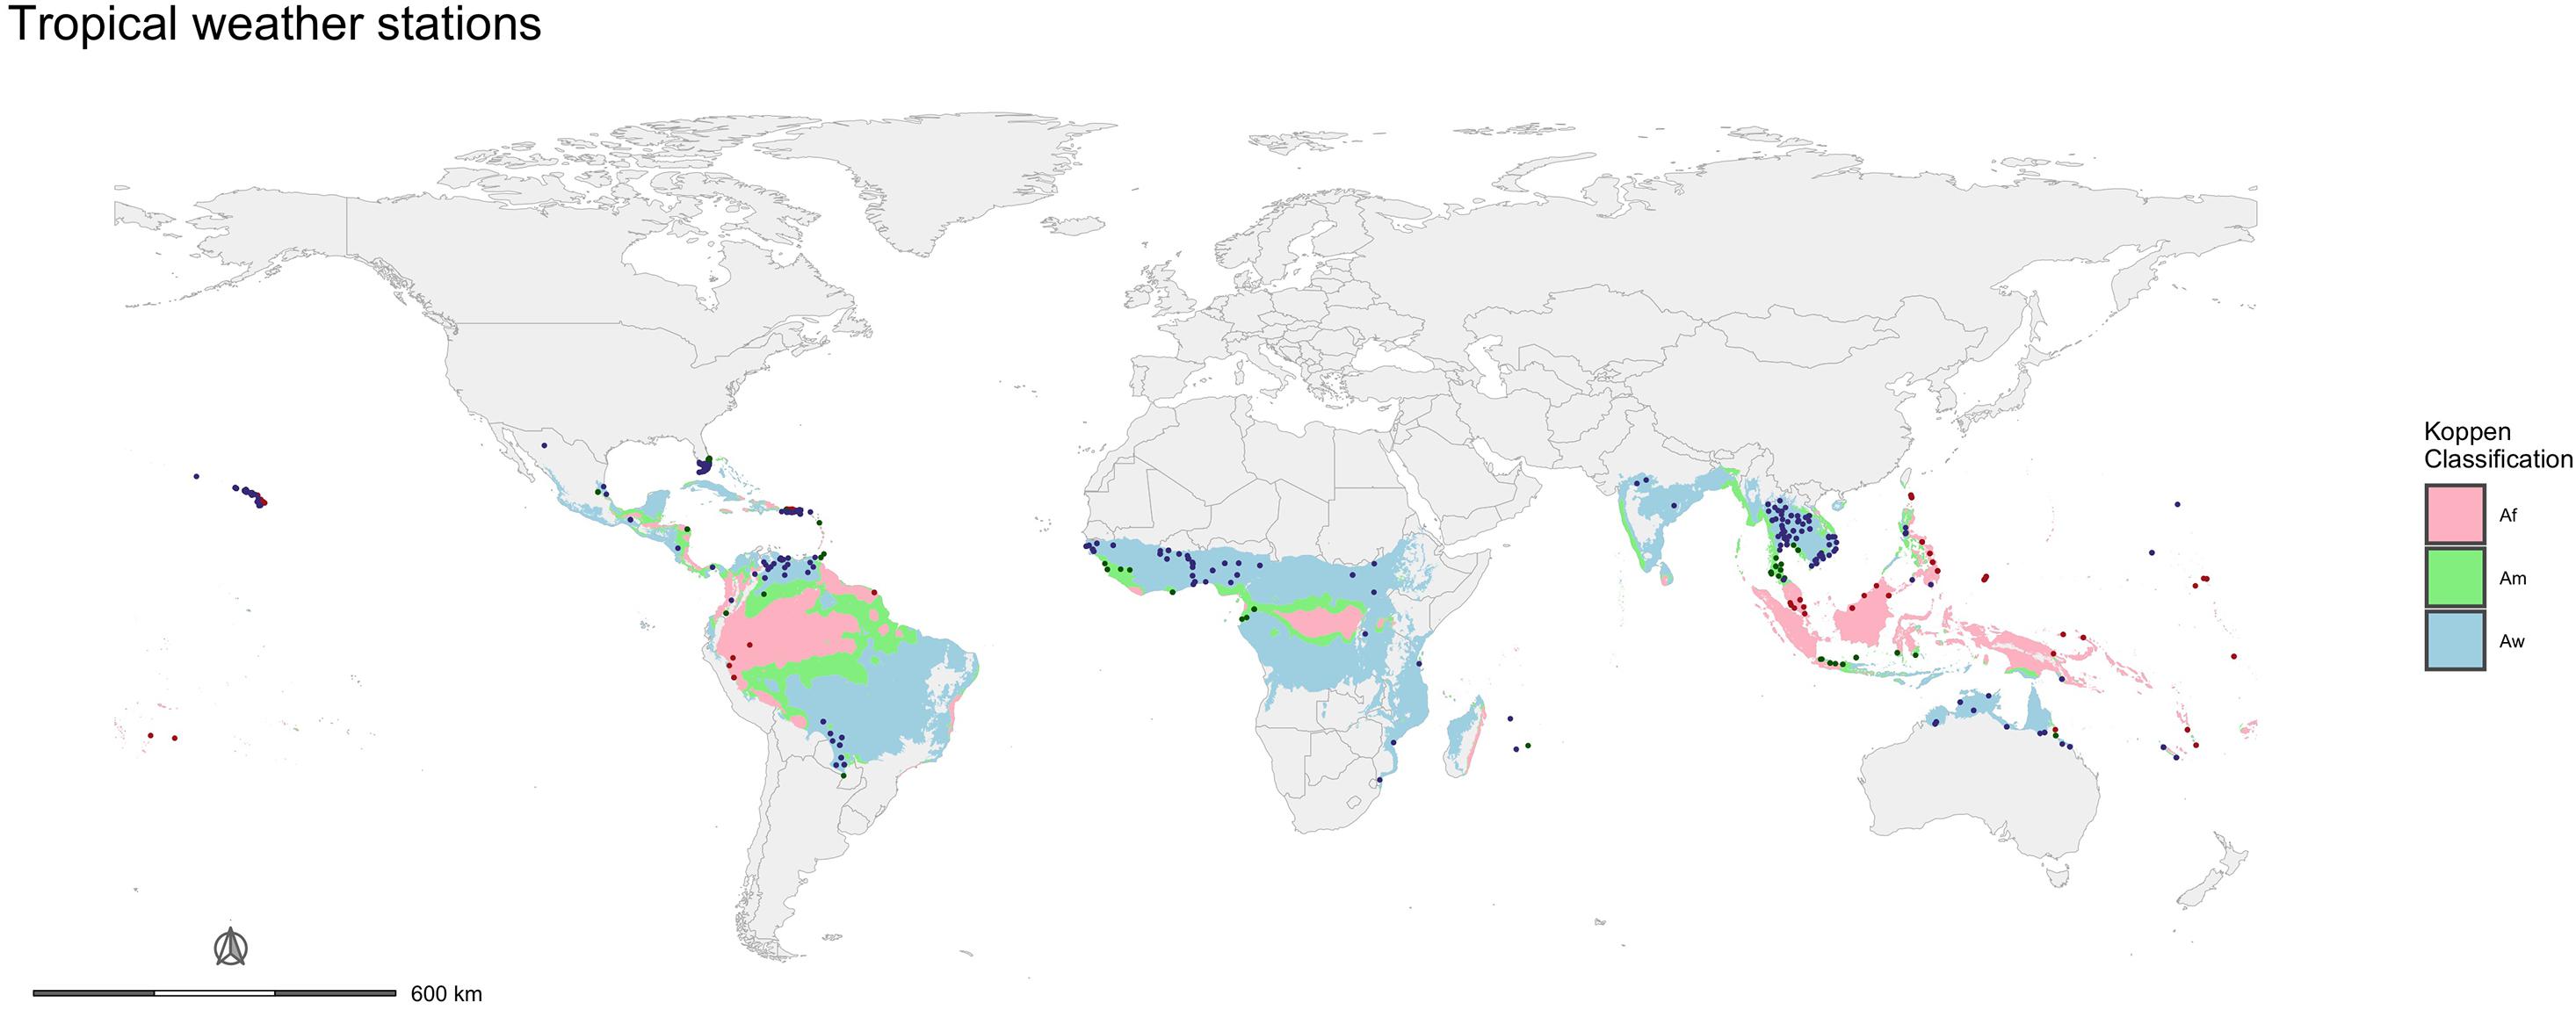
Figure 1. Location of weather stations with maximum and minimum temperatures in tropical areas. The dots represent station locations and are color-coded by Köppen-Geiger classification. Data source: NOAA, GHCN.
Urban Growth Status and Indicators
We obtained urban status and growth data from a variety of sources. We used the night-time lights data from the Earth Observations Group (EOG) at NOAA/NCEI for 2016 to help identify urban infrastructure and therefore levels of built-up area. These data included values for average radiance as composite images created with the Visible Infrared Imaging Radiometer Suite (6 tiles) (VIIRS) Day/Night Band (DNB). Version 1 products span the globe from 75N latitude to 65S in 15 arc-second resolution. The radiance values were provided in units of nano-watt per square centimeter per steradian. The steradian is the square radian and the SI unit for a solid angle. It is used in three-dimensional geometry, and is analogous to the radian, which quantifies planar angles (Earth Observation Group, NOAA National Centers for Environmental Information). The larger the radiance value, the greater the illumination signal, and the greater the built-up area. We used the radiance value in combination with population densities to distinguish between urban and non-urban areas and also examine changes in temperatures across urban gradients of infrastructure (see below).
We used population density data provided by the Global Human Settlements Layer (GHSL) (Corbane et al., 2018). The Global Human Settlements Layer is supported by the Joint Research Centre (JRC) and the DG for Regional and Urban Policy (DG REGIO) of the European Commission, together with the international partnership GEO Human Planet Initiative of the GEO Human Planet Initiative. The intent of the GHSL project is to provide global spatial information about the human presence on the planet over time (Freire et al., 2016; Schiavina et al., 2019). The data were generated from evidence-based analytics and knowledge using new spatial data mining technologies. These are high resolution data (cell size is 62,500 m2 or 0.0625 km2). An exploratory data analysis suggests faster changes in the tropics, particularly after 1990, than the rest of the world in terms of urban built-up area (Figure 2).
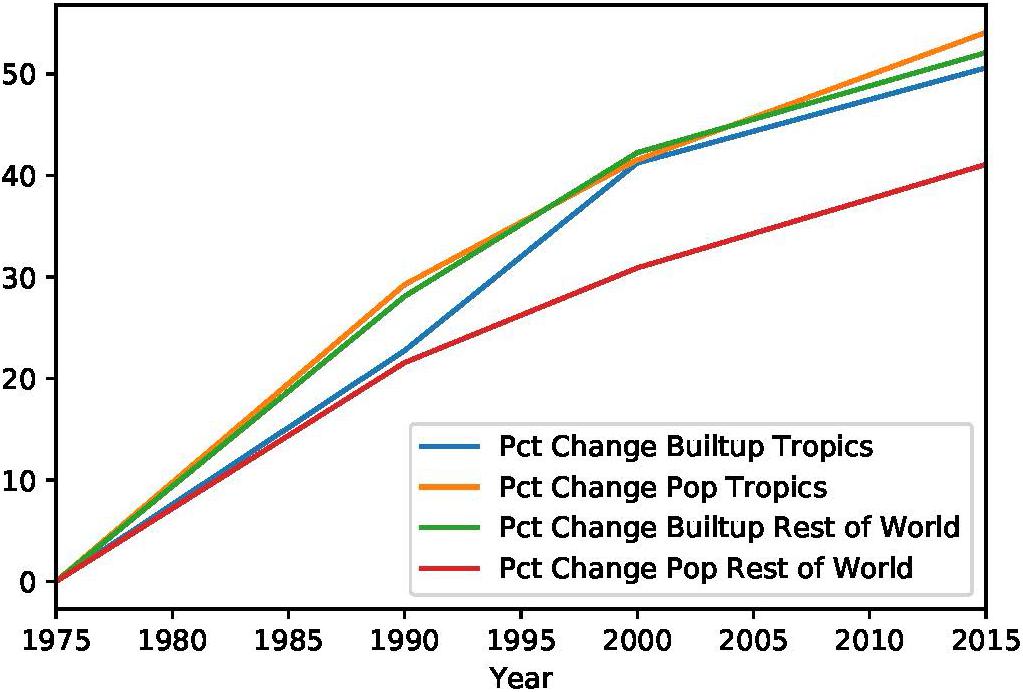
Figure 2. Changes in built up area and population in the world and tropics, 1975 – 2015. Data source: GHSL.
Finally, we defined changes in urban population size for selected cities with the use of the United Nations, Department of Economic and Social Affairs urban agglomerations larger than 300,000 population database (UN, 2018). These data provided the urban names, country, latitude and longitude and estimated population size of 1,860 cities with over 300,000 population in 2015. The population data include annual figures from 1950 to 2035. We used approximately 205 UN urban areas located in tropical zones (Figure 3) to identify changes in temperature across urban population size.
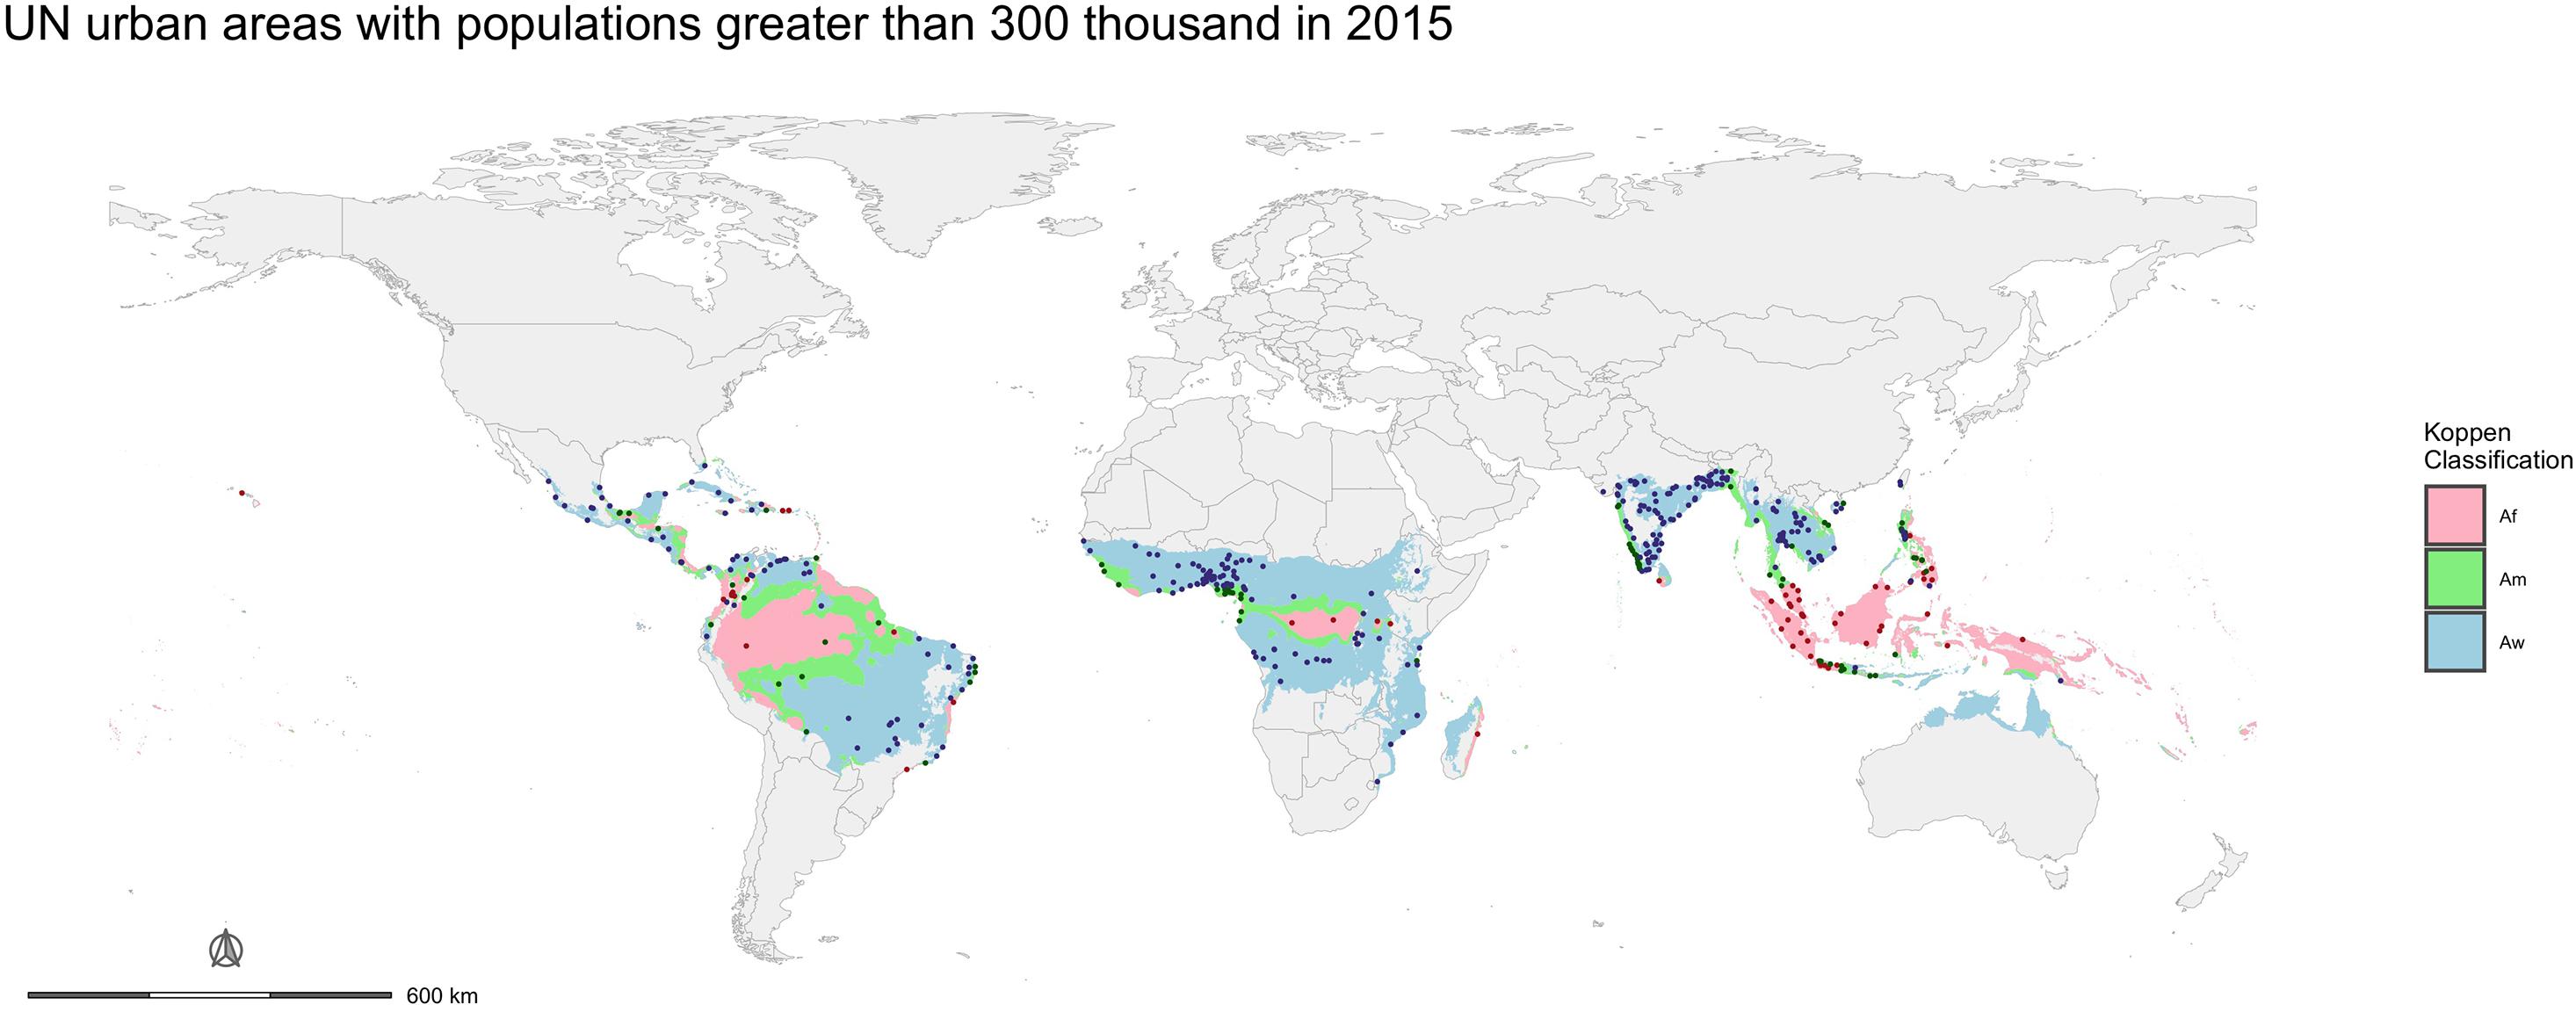
Figure 3. Location of cities with more than 300,000 population in 2015 within tropical climates. The dots represent city locations and are color-coded by Köppen-Geiger classification. Data source: UN, 2018.
Regional, National, and Intra-Urban Data
We distinguished regional and national units using regional definitions by the United Nations and national boundaries provided by data made available through Natural Earth. These data include physical boundaries and some statistics for 247 countries in the world (see vector data3). The datasets also carry UN regional and sub-regional classifications.
Finally, Intra-urban form characteristics were obtained as LCZs for tropical zones created through the World Urban Database and Access Portal Tools project (WUDAPT) (Bechtel et al., 2019). The project provided maps developed by scientists around the world that have used a standardized and consistent framework. The LCZ classifications (Stewart and Oke, 2012) identify the type of urban form found in and around cities. We examined differences in temperature within LCZs in 11 urban areas (Figure 4).
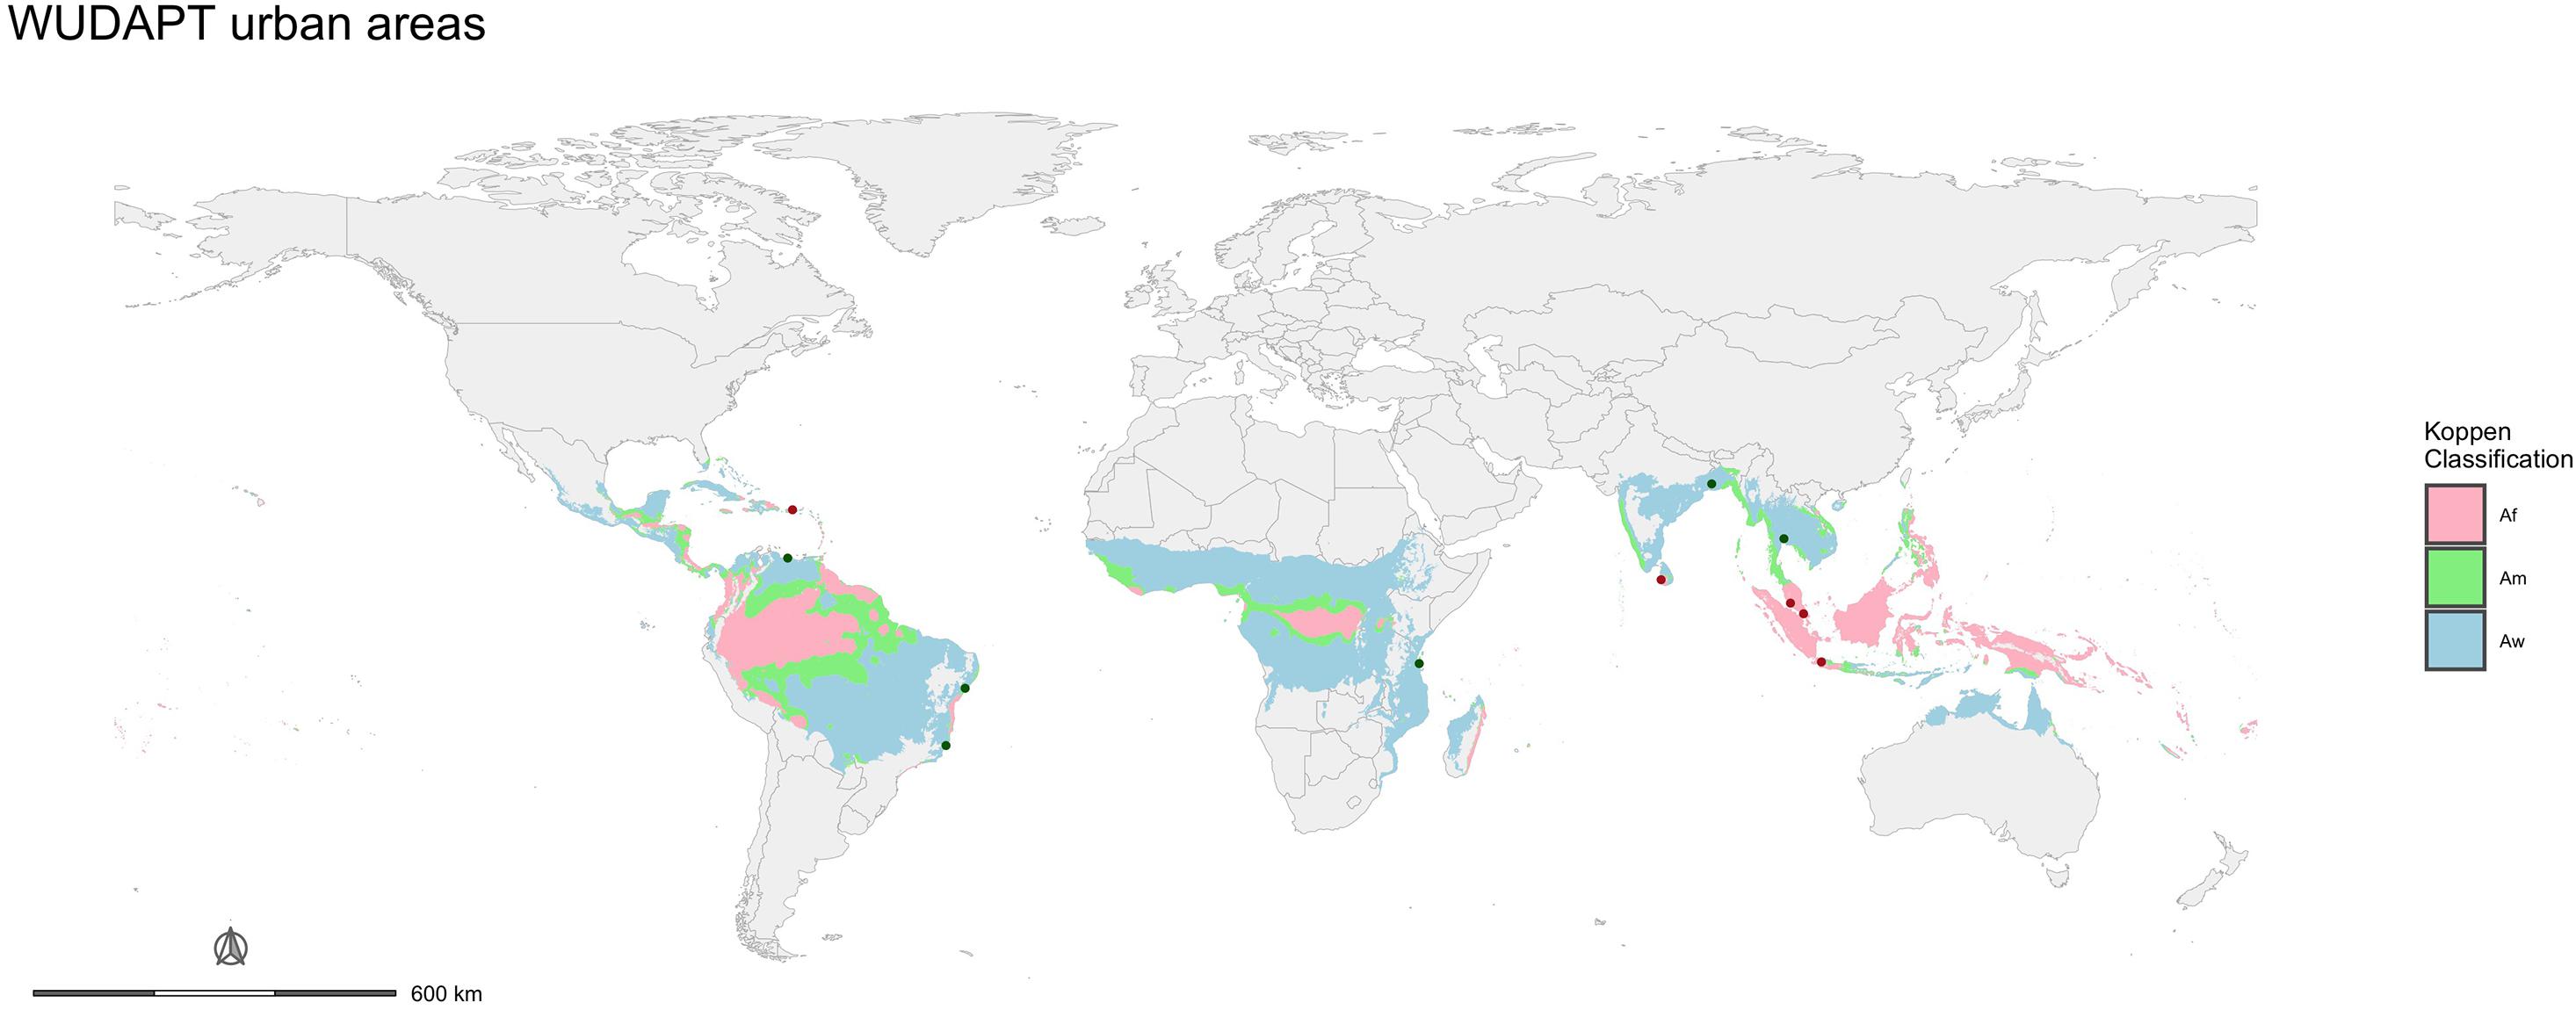
Figure 4. Location of cities with local climate zones data in tropical zones. The dots represent city locations and are color-coded by Köppen-Geiger classification. Data Source: WUDAPT.
Methods
The daily temperature data for the period of 1960–2020 were averaged by the day of the year, the season and the year across tropical sub-zones for urban and non-urban areas. The day of year was calculated for both stations in the northern and southern hemispheres. The data for the southern hemisphere stations were converted to the comparable day of year in the northern hemisphere so they could be combined. The seasonal distinctions were defined as spring, summer, fall and winter and identified through equinox and solstice dates. We defined the seasons by latitude (above and below the equator).
The first assessment was to distinguish urban from non-urban located weather stations. We did this through integrating a number of different variables. For an area to be non-urban, we set a threshold of low radiance values (i.e., a cell had to demonstrate a radiance values of 5 or less) and a population density of below 200 people per km2.4 To obtain values for both radiance and population density we extracted the mean values within 1000m of the cell location of the weather station.
We then extracted the mean maximum and minimum temperatures for each weather station averaged by day of year, season, year and by urban – non-urban category. We presented the change over time for daily, seasonal and yearly data for a visual inspection of changes. We then calculated the total and urban warming per decade. Total warming includes climate change and the urban effect on temperature. The urban warming values include only the urban effect. We obtained the total warming value by calculating the change in temperatures across the time period for both urban and non-urban locations. The urban warming temperatures was calculated by subtracting the background warming (i.e., the warming identified in the non-urban areas) from warming experienced in urban areas for each time period. If the rate of change in urban areas was less than that of the non-urban rate the value was given 0. In this case, the urban areas warmed, but we found no specific urban warming effect. Alternatively, if the urban area warmed to a greater extent than the non-urban areas, the amount of extra warming was arguably due to an urban warming effect. This could be interpreted as an increase in canopy UHI over time.
For the next analysis, we examined the impact of predictor factors across a continuum of values for each variable. This analysis was limited to one year’s data. In this case, given that one of the indicators has limited historical data (i.e., nighttime lights radiance data), we focused on one year of data and compare temperature means for that year across different predictor value gradients. This is a “space-for-time” (SFT) substitution approach. This approach suggests that over time, with increasing urban growth, we should see an increase of urban indicator (radiance or population size, for example). Lower indicator values translate to lower levels of “urbanness.” The predictor value was then associated with the temperature mean. The space-for-time substitution approach is often used in ecological studies and is best when used for discussing which particular processes are in concordance with the observed spatial pattern (Buyantuyev et al., 2012; Damgaard, 2019), as is our goal. Examining temperature differences across a wide range of urban indicator types and values allowed us to test for the impact of urbanization without making distinctions between what is urban and what is non-urban. We used OLS multivariate regression models to identify the strength of the relationship between the predictor and temperature data. We standardized the values of the predictors so as to compare the importance of coefficients.
Finally, we compared the temperatures across intra-urban land use patterns defined by the LCZs. We identified temperatures at the annual scale and across different tropical climate zones and compared the mean temperatures as a way to identify which patterns provide for the warmest temperatures.
Results
The first part of this section presents the changes in temperatures in tropical climate zones with emphasis on the differences between urban and non-urban areas. The second part of this section focuses on factors that are associated with urban warming.
Temperatures in Urban and Non-urban Areas in the Tropics
Weather station data distinguished by urban and non-urban status for daily, seasonal and annual means for maximum and minimum temperatures suggest increases during the 1960 to 2020 period. When all tropical station data are combined, the data suggest an increasing trend in the maximum and minimum daily temperatures and that during the cooler days of the year, urban areas have warmed more rapidly than during other periods (Figure 5). Dividing stations by location into tropical climate zones seems to demonstrate that temperatures in all tropical climates, including rainforest (Af), wet and dry savanna (Aw) and monsoon (Am) zones, are increasing and there is a growing difference between urban and non-urban maximum and minimum temperatures (Figure 6).
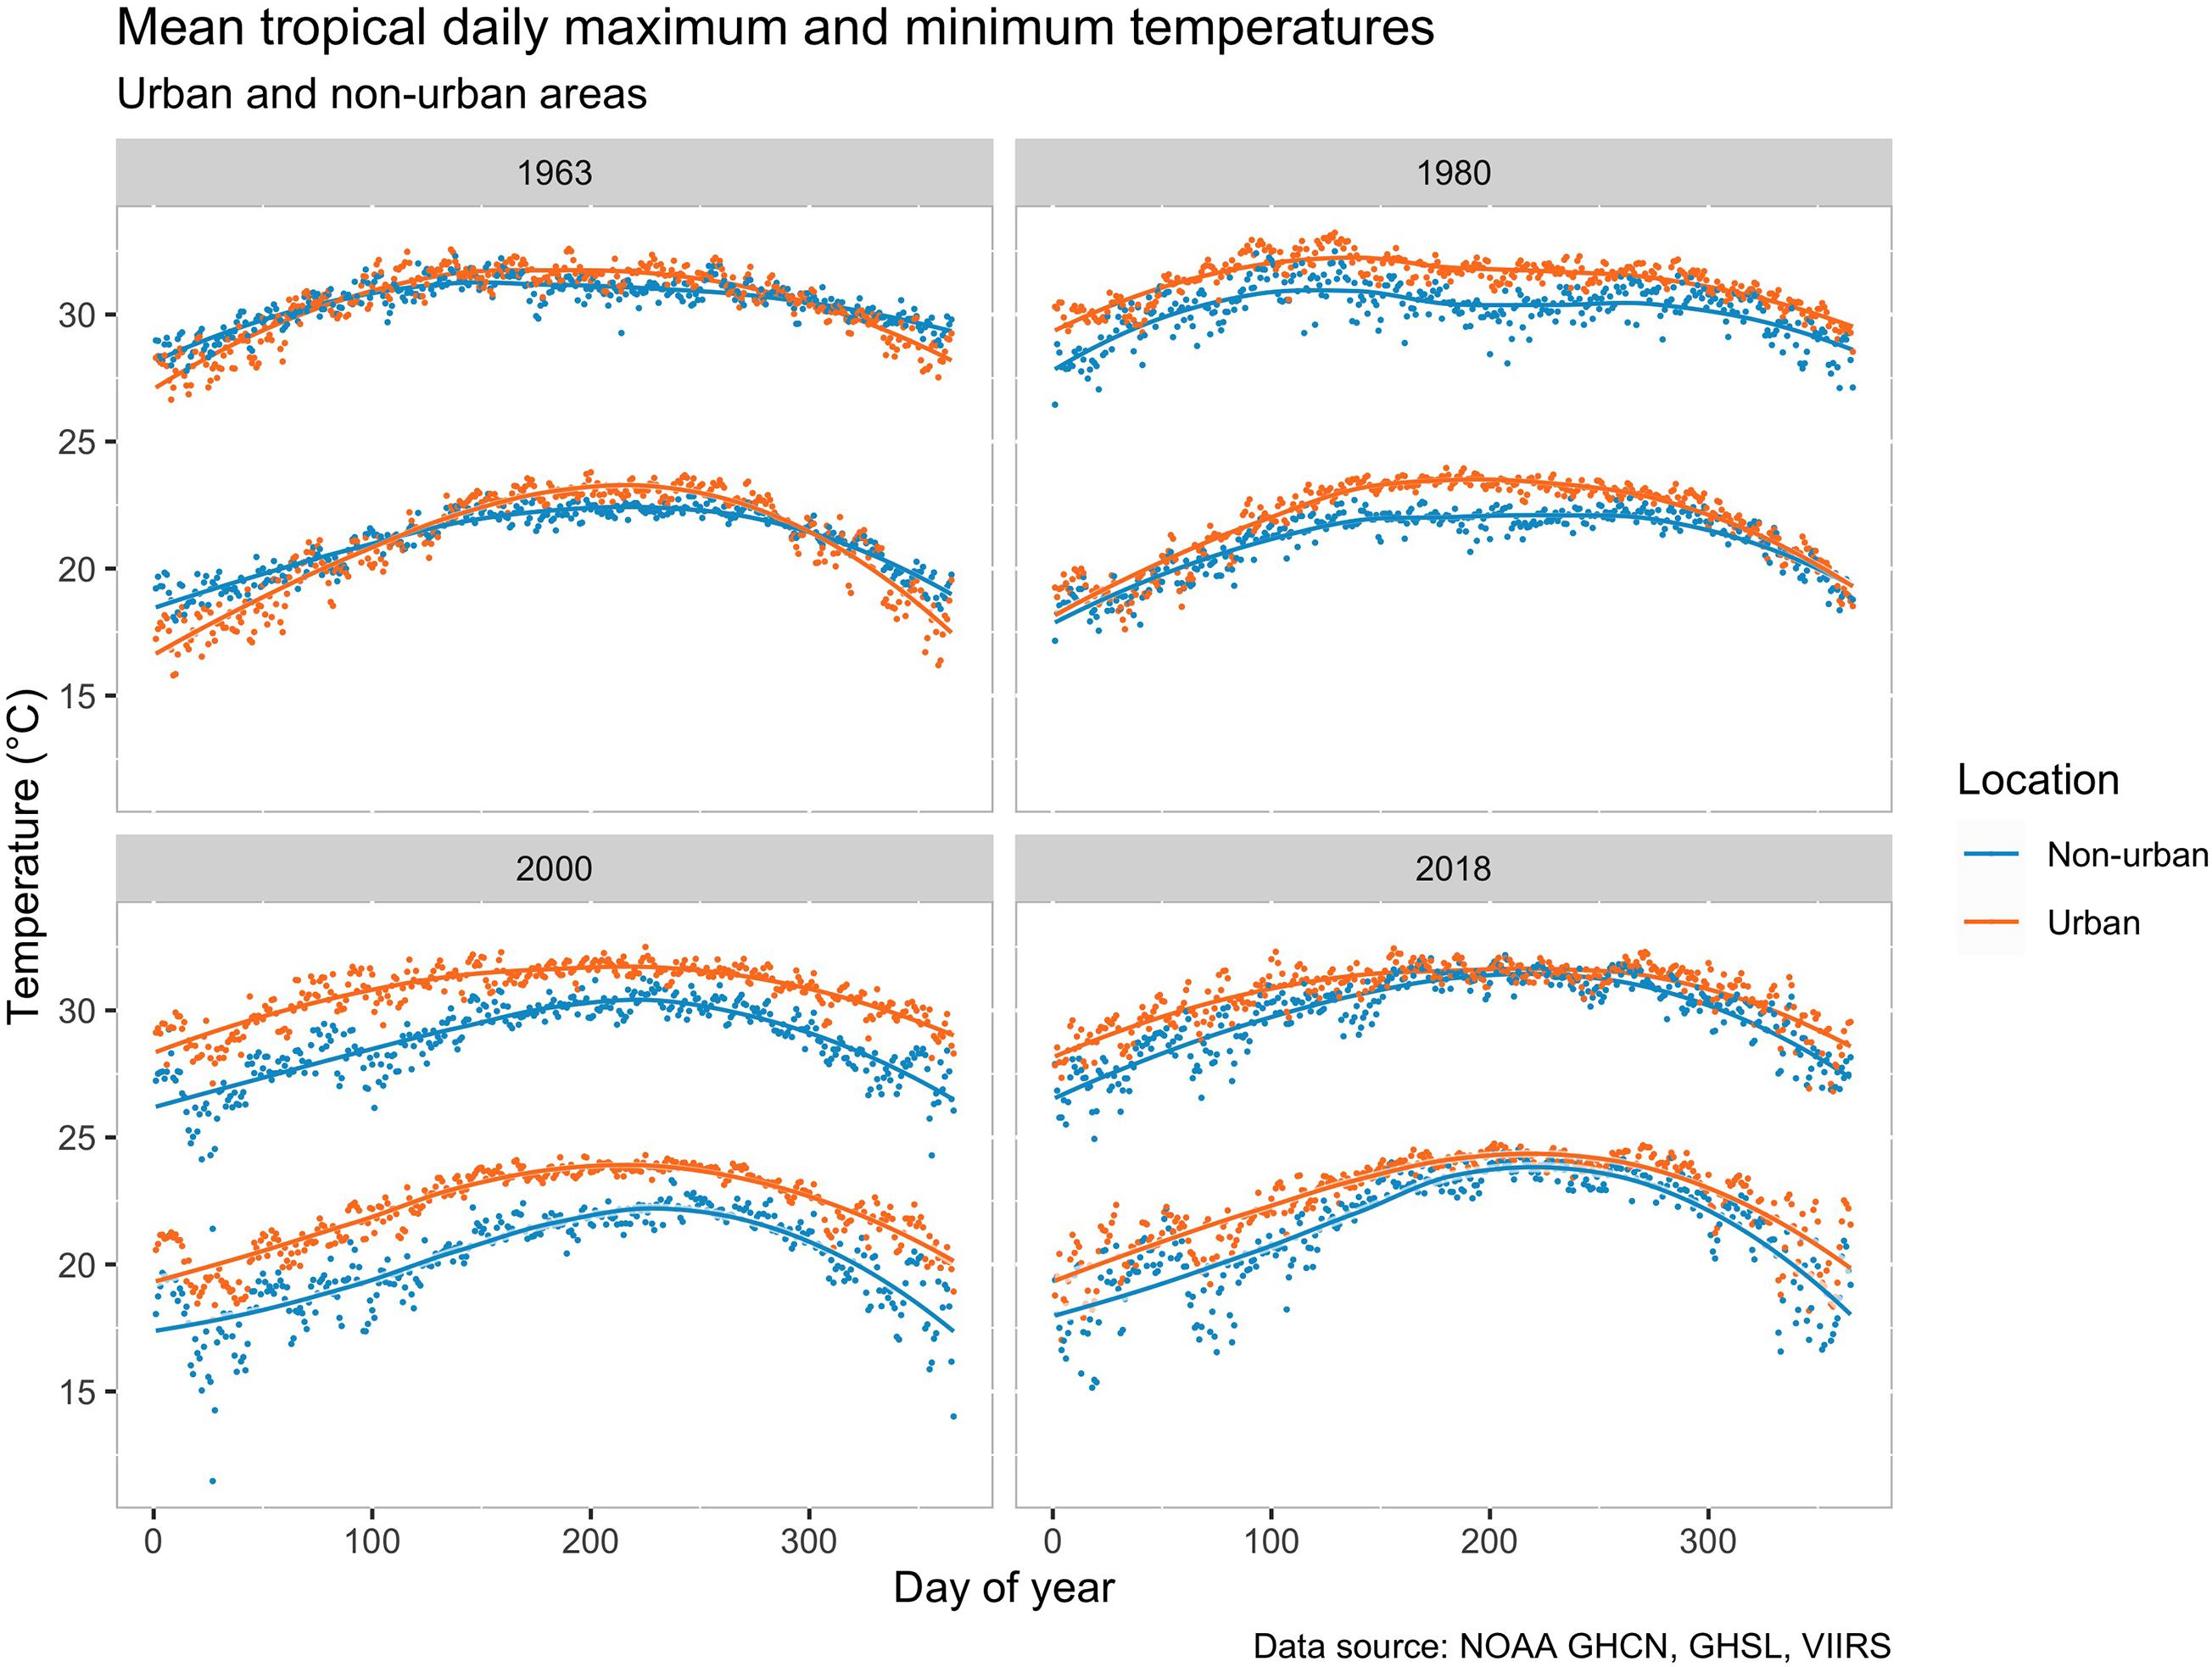
Figure 5. Change in mean tropical daily maximum and minimum temperatures over 55 years in urban and non-urban areas. The higher points and curves on each mini-plot represent the maximum temperatures and the lower points and curves represent the minimum temperatures. Data source: NOAA, GHCN.
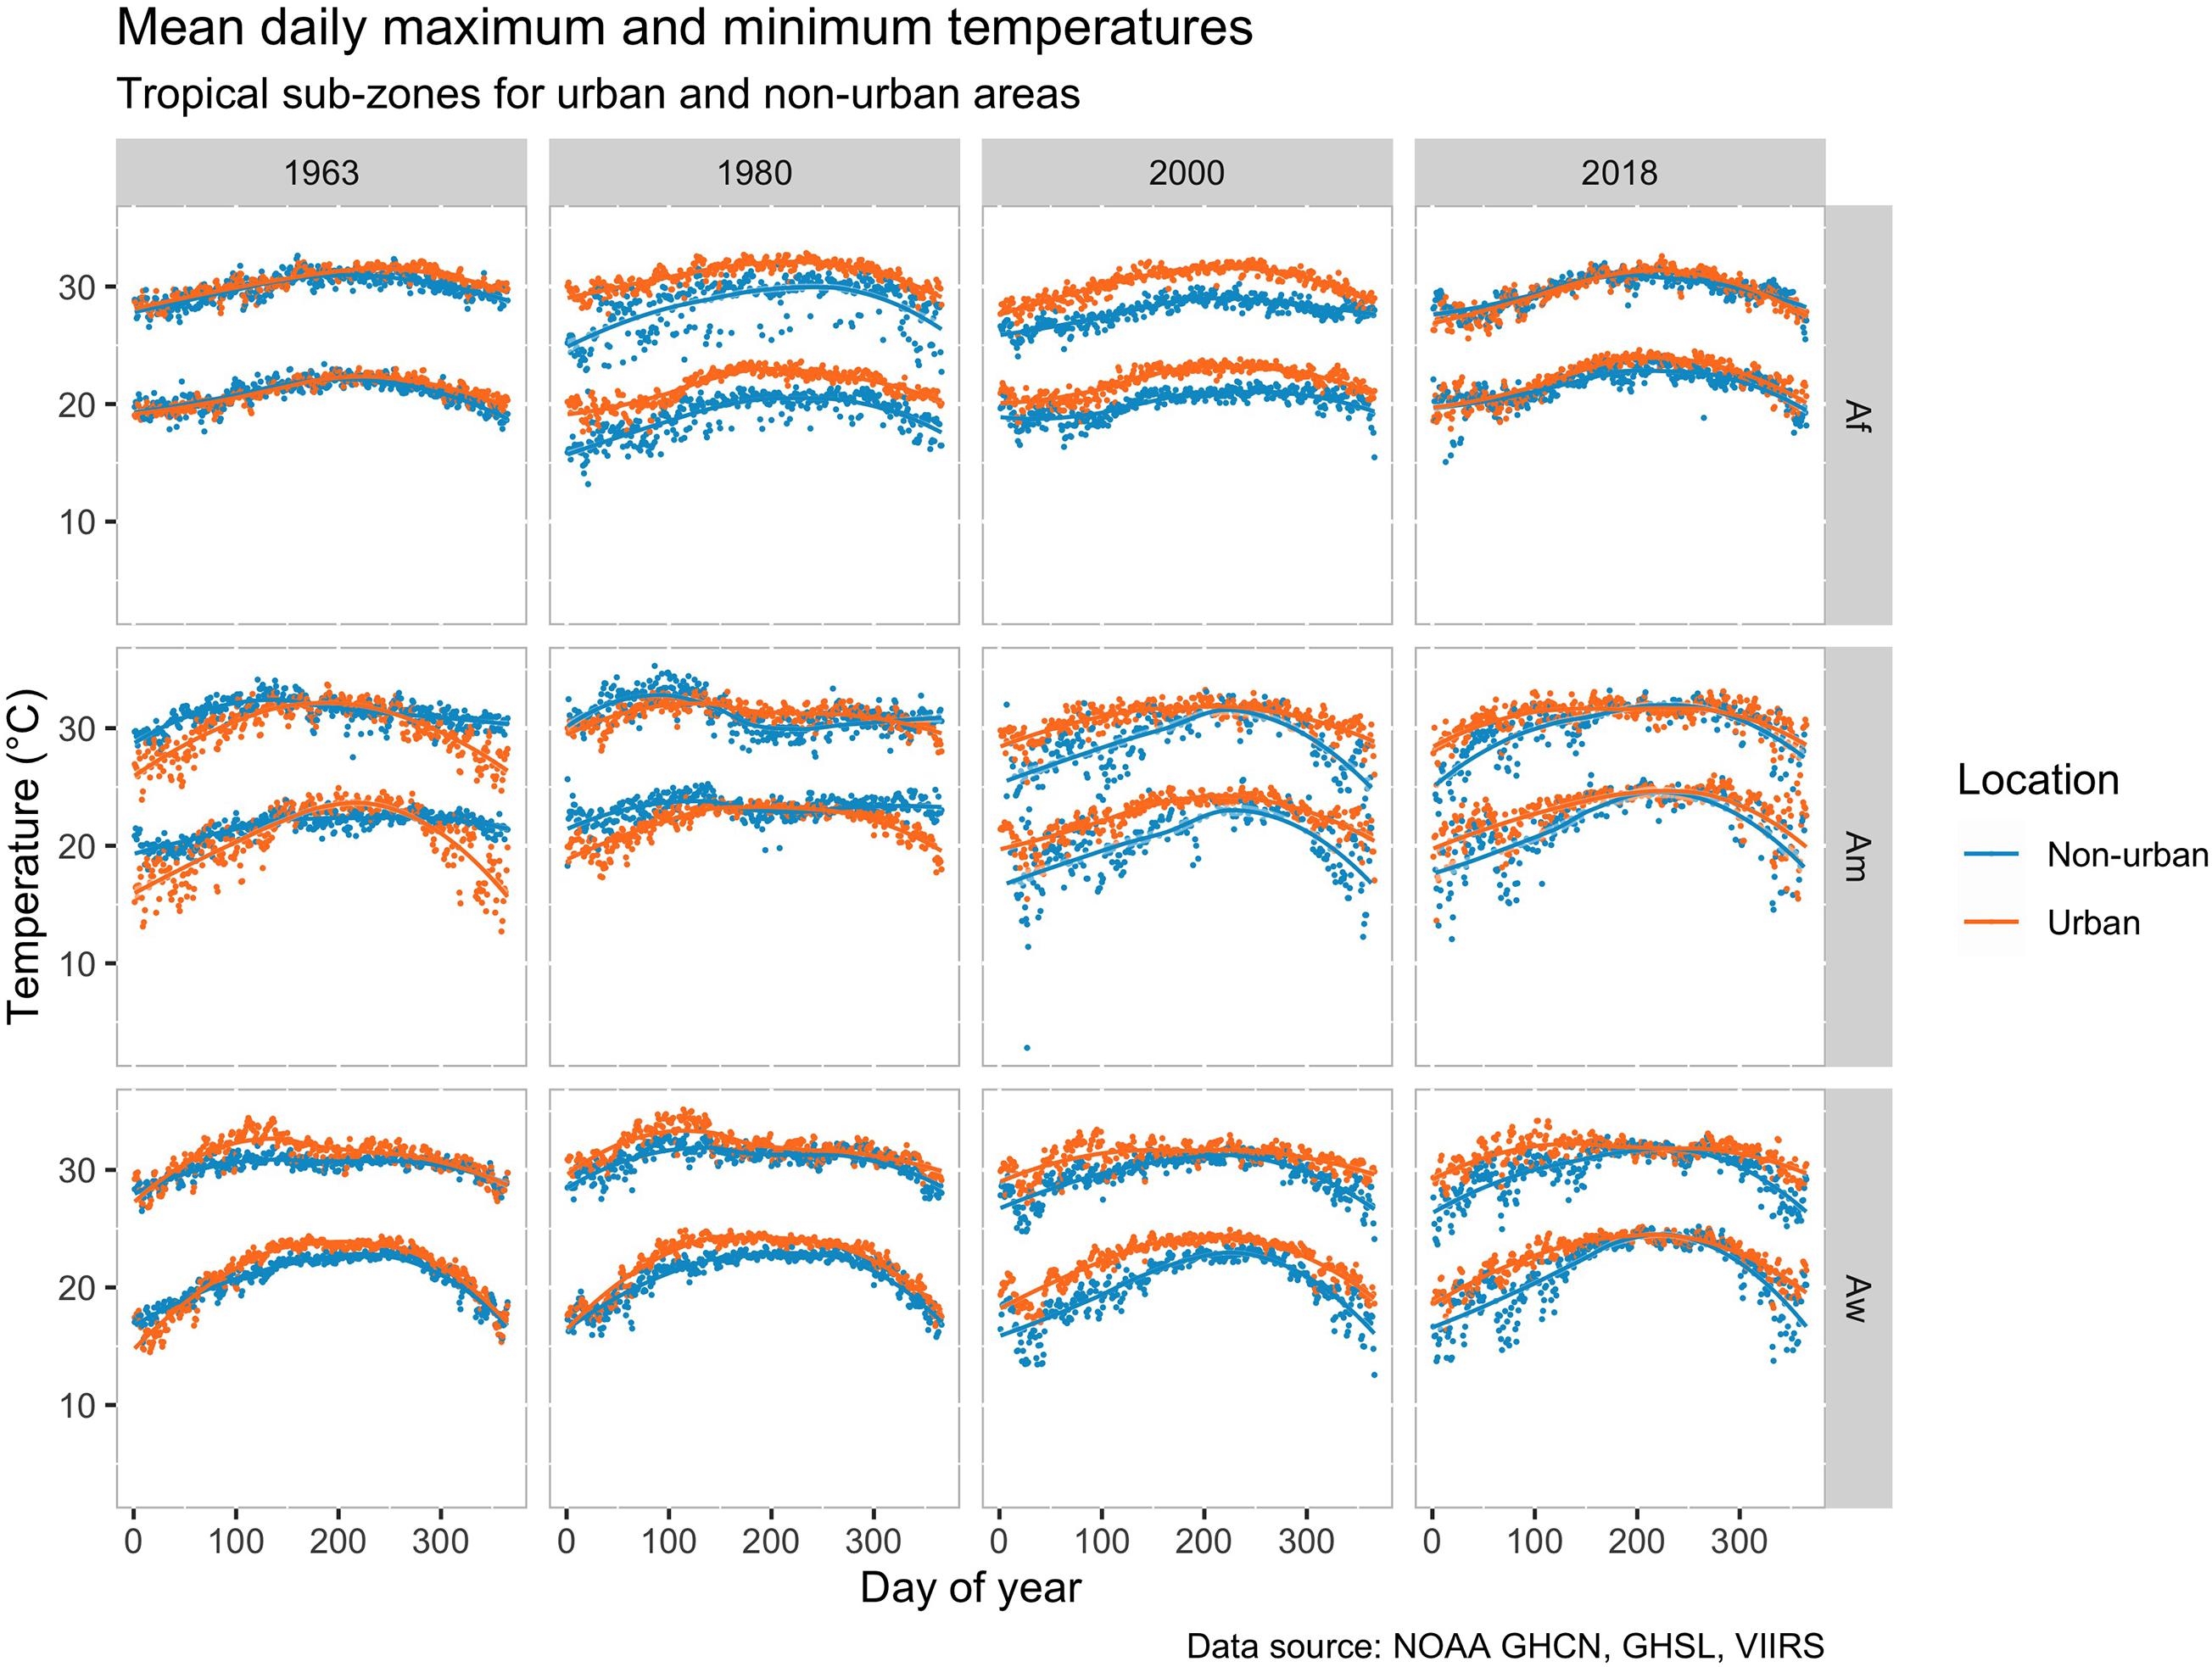
Figure 6. Change in mean daily maximum and minimum temperatures across 55 years in urban and non-urban areas by tropical zone. The higher points and curves on each mini-plot represent the maximum temperatures and the lower points and curves represent the minimum temperatures. Data source: NOAA, GHCN
The annual mean temperatures suggest a difference of 0.6–0.9°C between urban and non-urban tropical areas (Supplementary Table 1 and Figure 7). Over the time period, the change in minimum temperature differences is larger than the change in maximum temperature differences. This trend is evident across the analyses and makes sense, as UHI affects minimum and mean temperatures more than maximum temperatures (US EPA, 2008). According to these values the mean urban warming effect for all tropical areas is about 0.03°C per decade, but this increase is only demonstrated in the minimum temperatures.
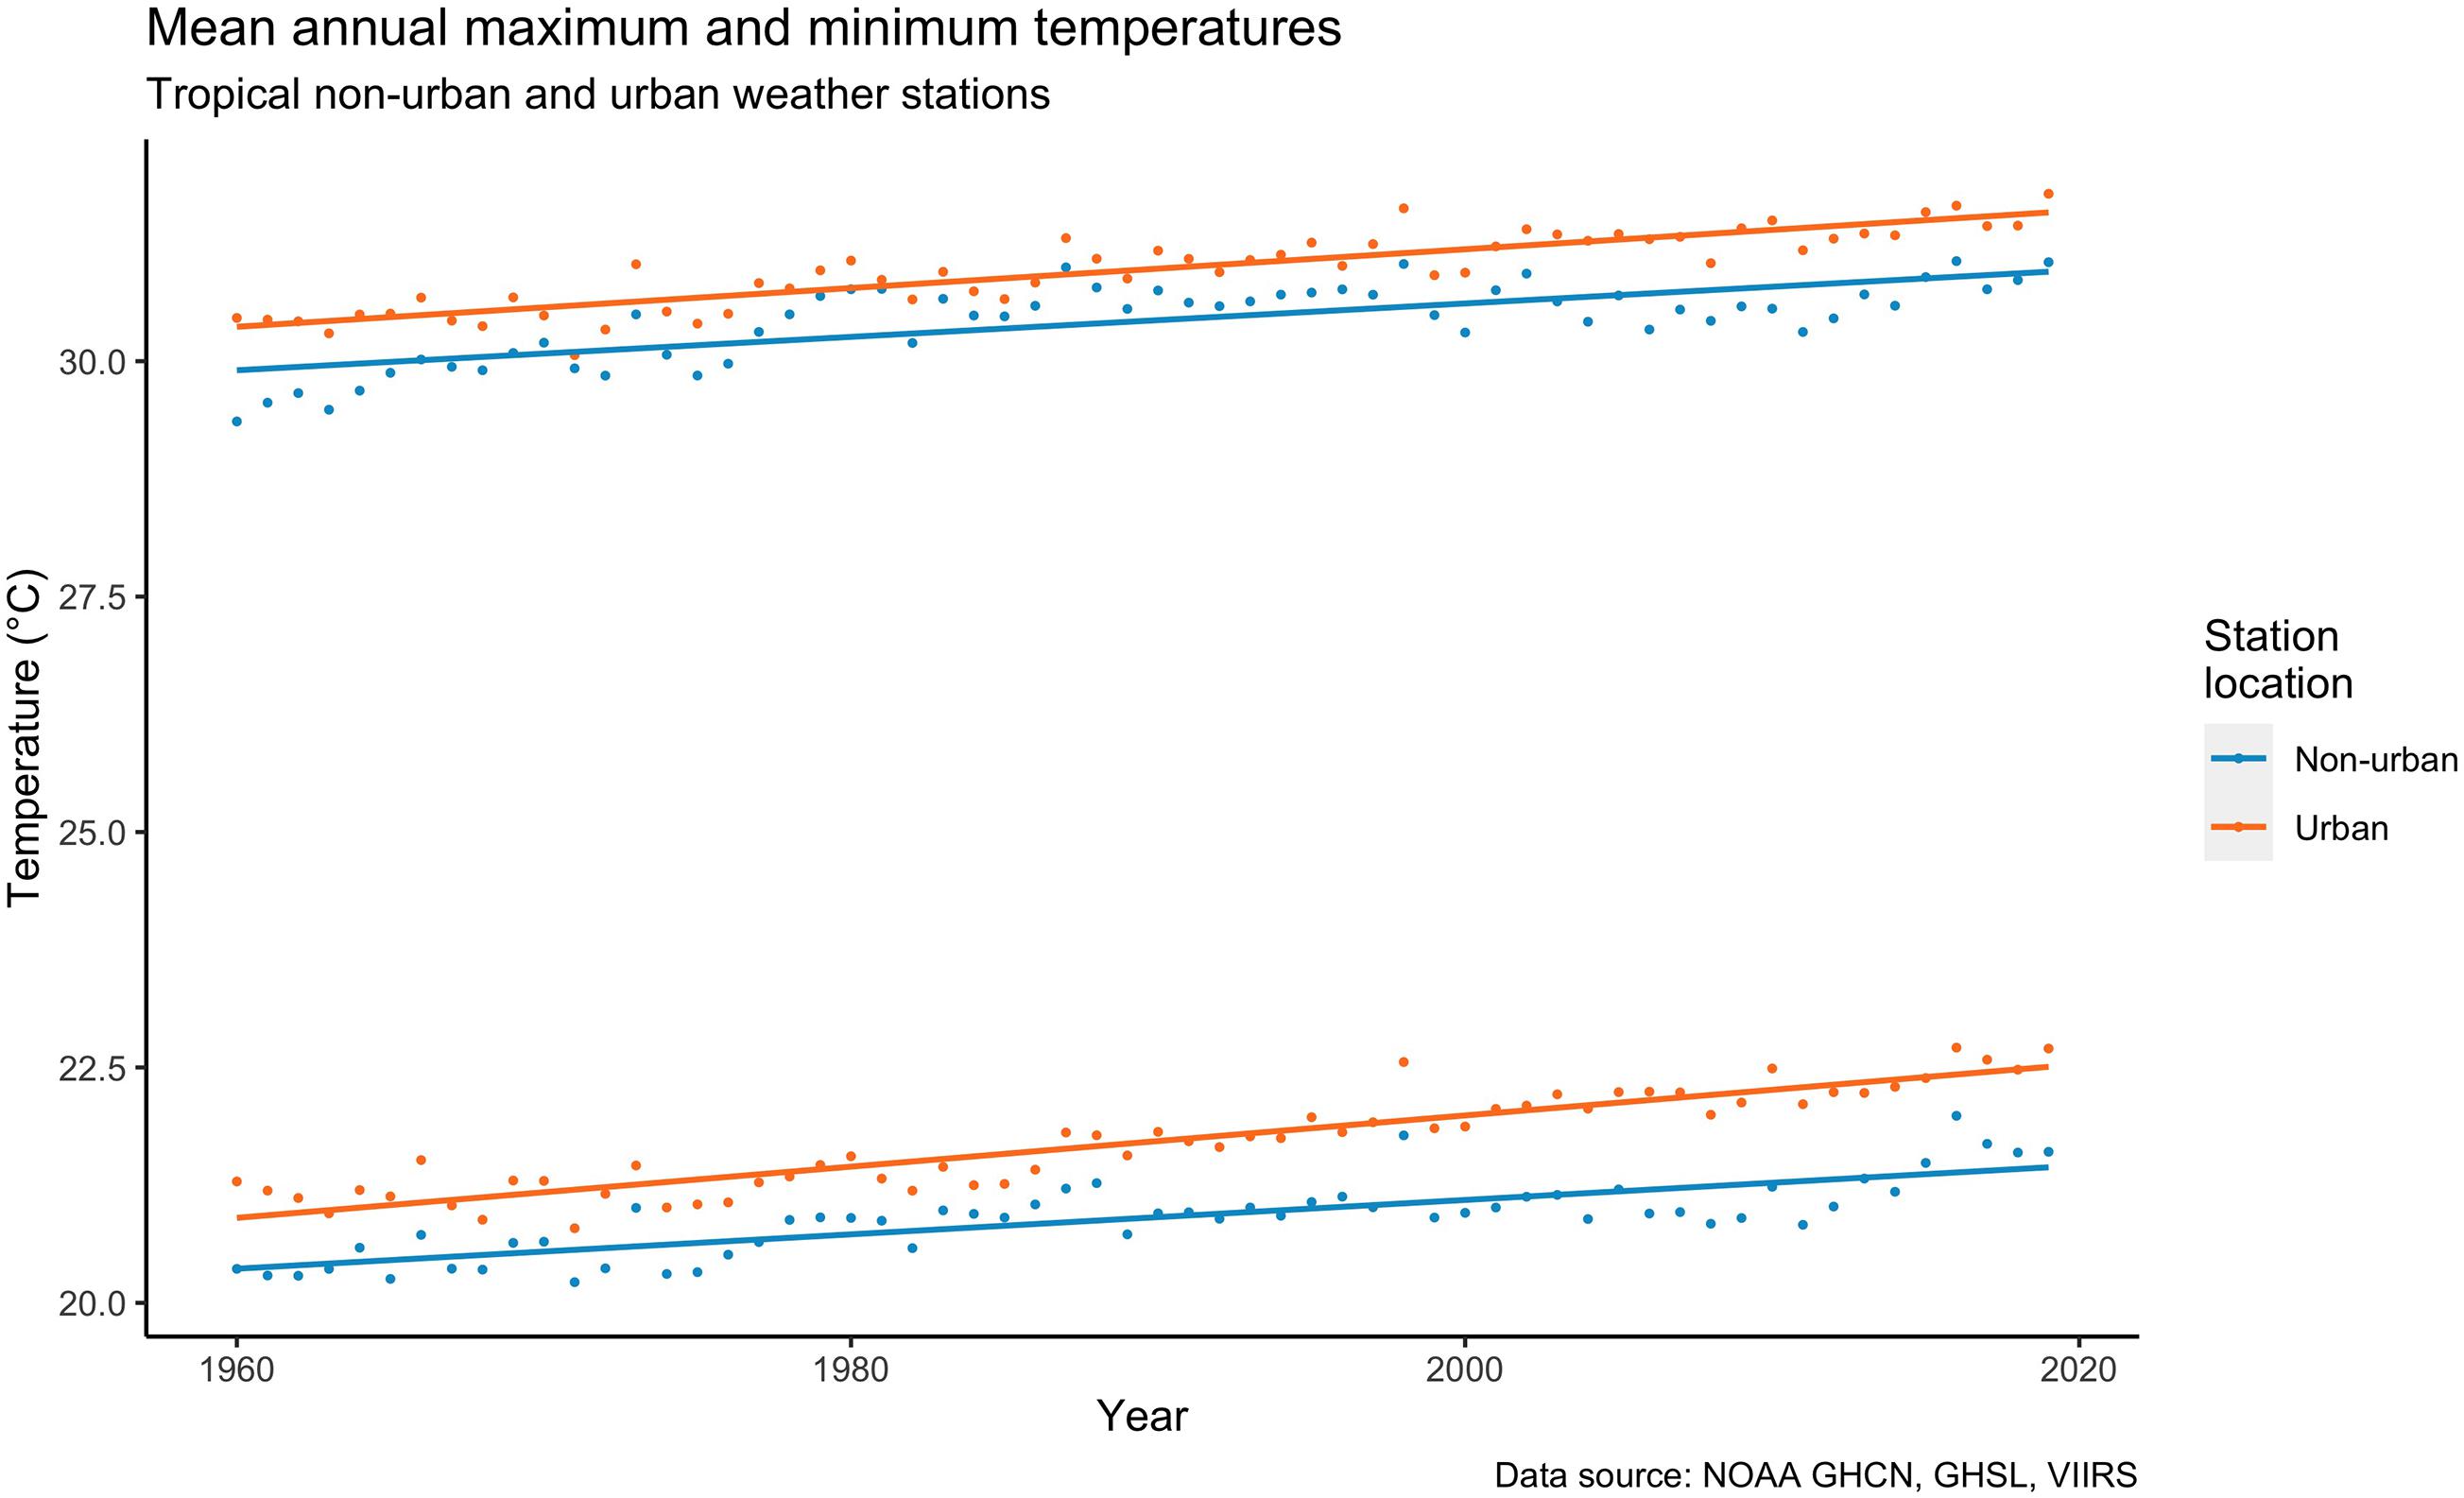
Figure 7. Mean annual maximum and minimum temperatures in tropical urban and non-urban areas. The higher points and curves on each mini-plot represent the maximum temperatures and the lower points and curves represent the minimum temperatures. Data source: NOAA, GHCN.
There are also differences in annual temperatures between urban and non-urban areas across different tropical zones (Figure 8 and Supplementary Table 2). In this case, the temperature differences vary. Rainforest urban areas typically had mean temperatures between 0.8 and 1.2°C higher than non-urban areas. Over time, an urban effect was demonstrated for minimum temperatures in this zone. In monsoonal zones, urban temperature means are between 0 and 1.6°C higher than non-urban areas. Over time, this zone experienced the largest urban warming effect for minimum temperatures, but there is also a monsoonal warming effect for maximum temperatures. In tropical wet-dry savanna climates, temperature means were between 0.3 and 0.9°C higher in urban areas than non-urban areas, but during the period, there is no evident urban warming effect. That is, over the 6 decade period in this zone, the temperatures in urban areas rose at approximately the same or lower rates than they did in non-urban areas.
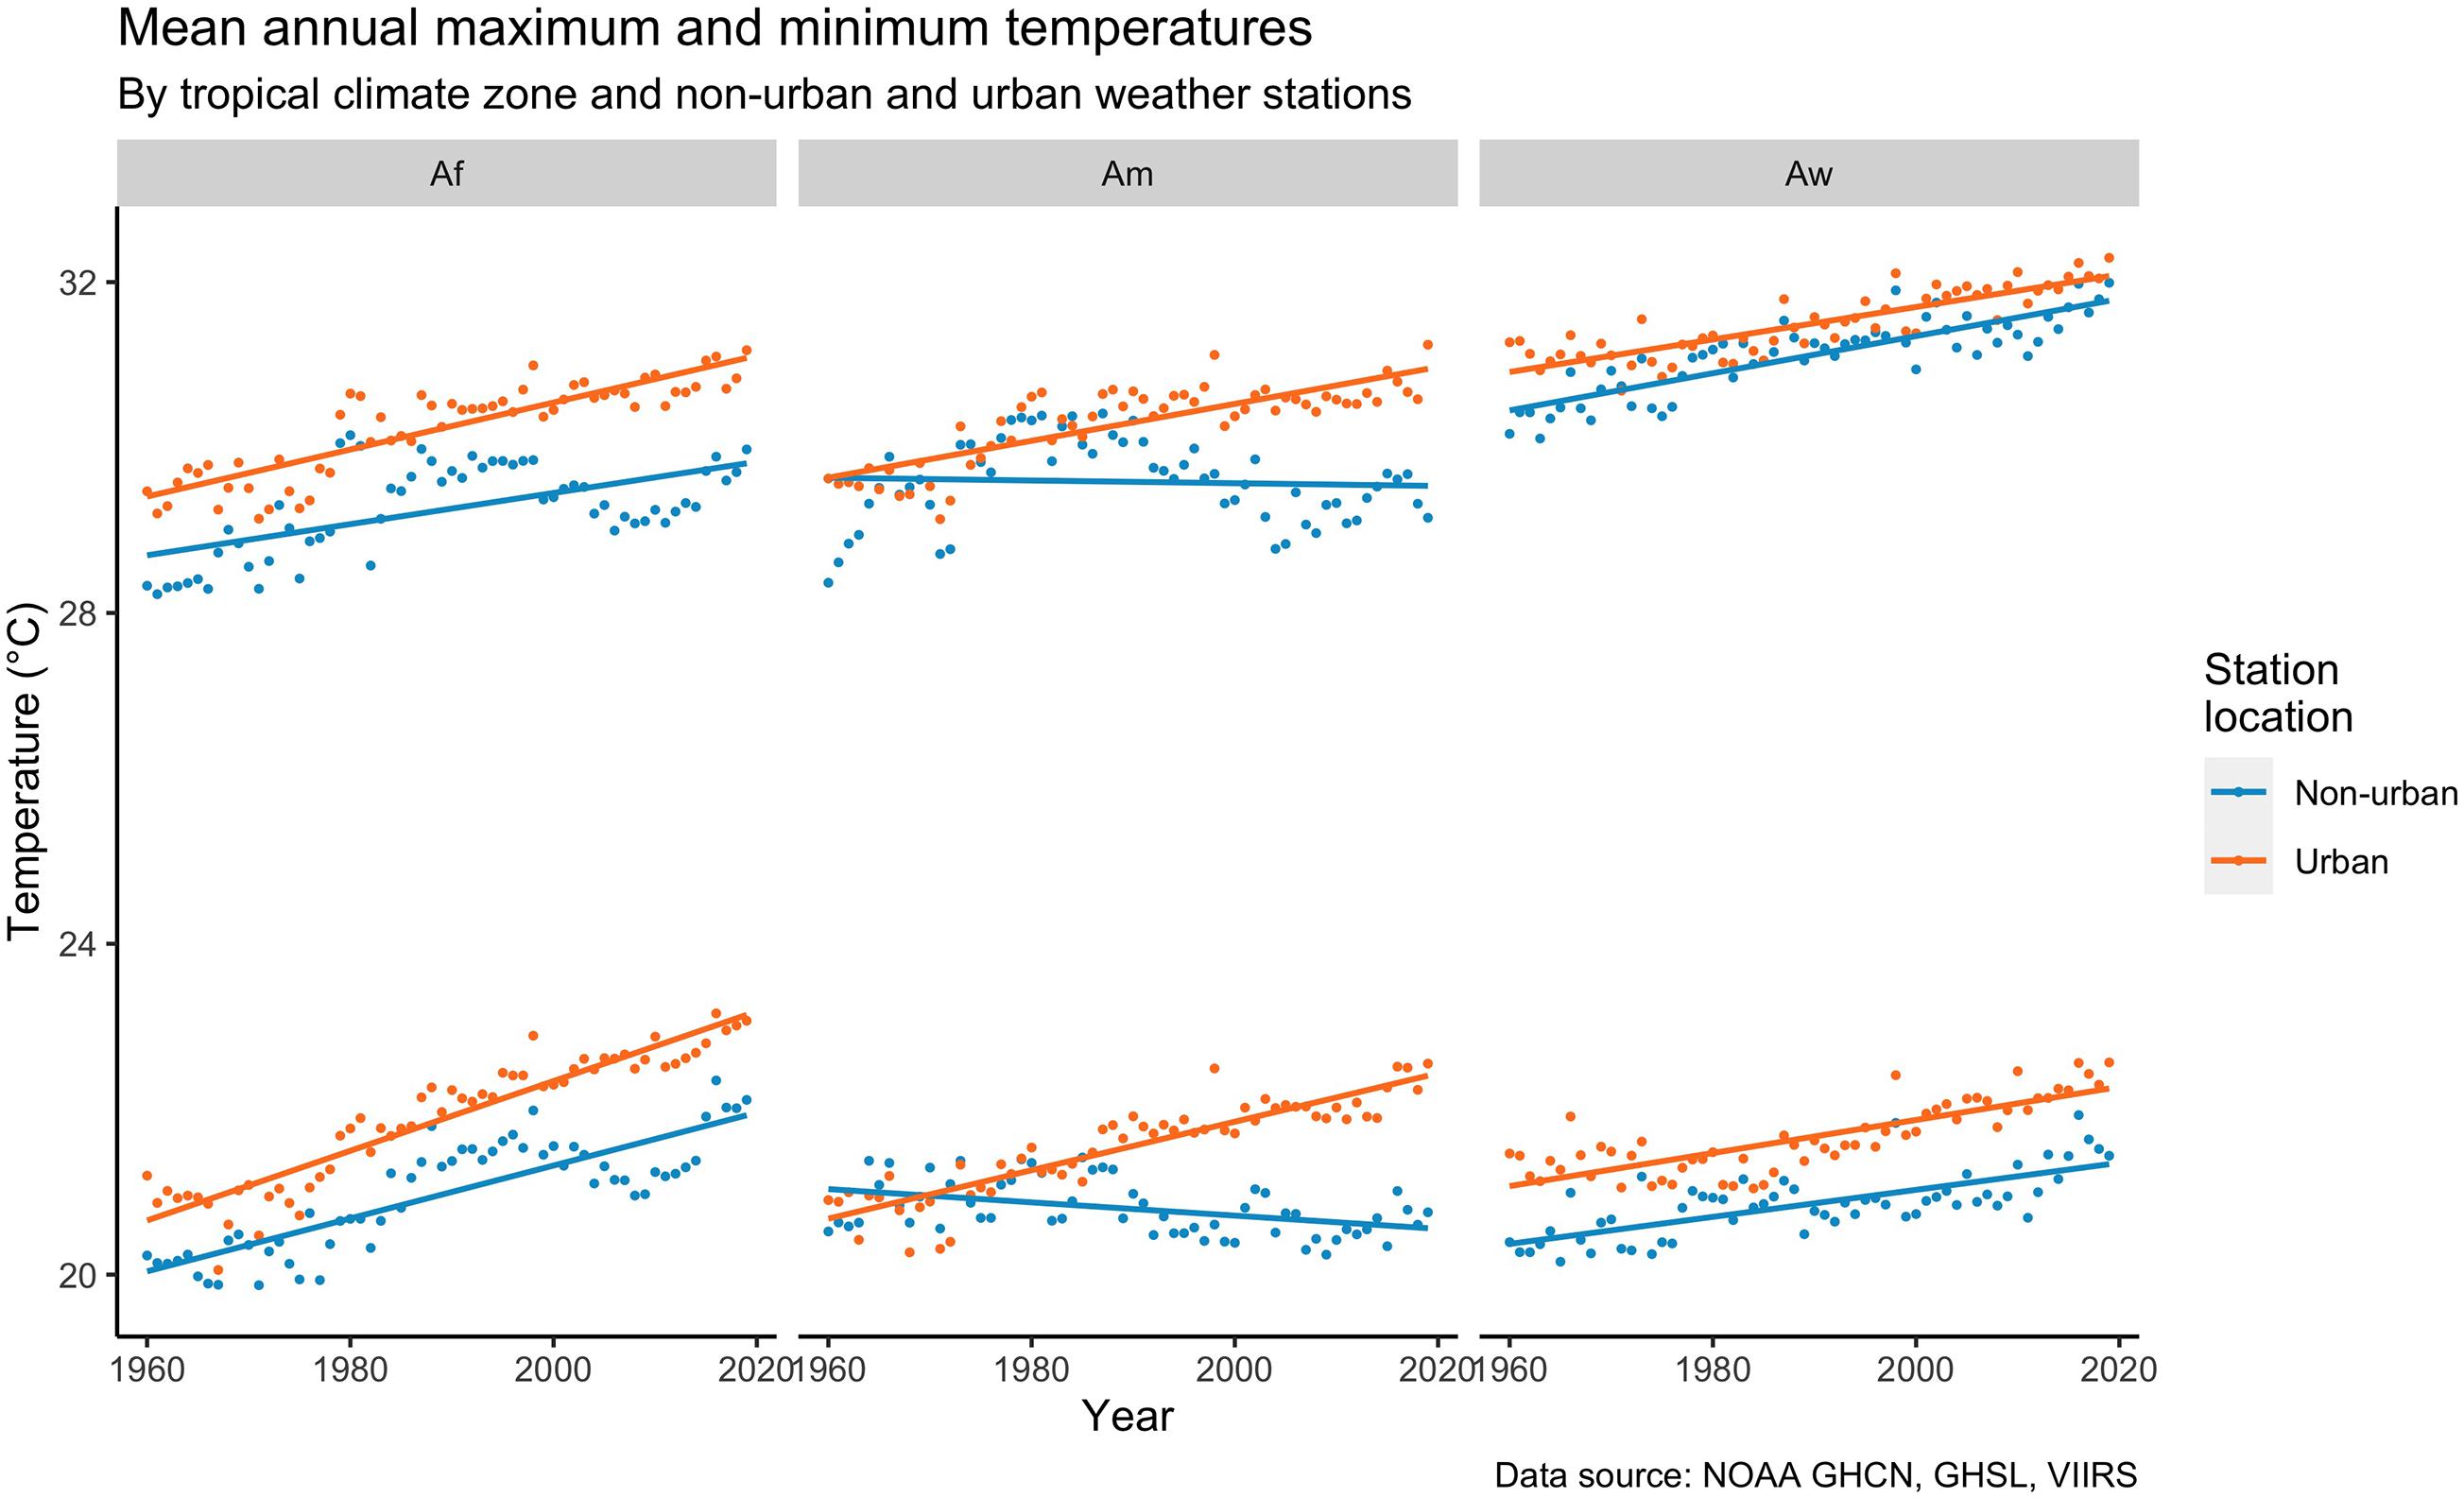
Figure 8. Mean annual maximum and minimum temperatures for urban and non-urban areas by tropical zone. The higher points and curves on each mini-plot represent the maximum temperatures and the lower points and curves represent the minimum temperatures. Data source: NOAA, GHCN.
The differences in temperatures between urban and non-urban areas also are evident across seasons as well as across tropical climate zones. Across tropical seasons the difference between urban and non-urban mean temperatures varied between 0.3 and 1.2°C (Figure 9). The overall warmest season is during the spring, at which time mean maximum temperatures reach 32.5°C in urban areas and 31.8°C in non-urban areas. The largest urban effect on temperature during the period was during the fall and winter seasons when urban warming increased temperatures in urban areas at the rate of between 0.03 and 0.18°C per decade for maximum temperatures and 0.03–0.16°C for minimum temperatures per decade. There was an urban warming effect during the spring, during which time urban areas warmed by 0.3°C more than non-urban areas. There was no urban warming effect during the summer season (Supplementary Table 3).
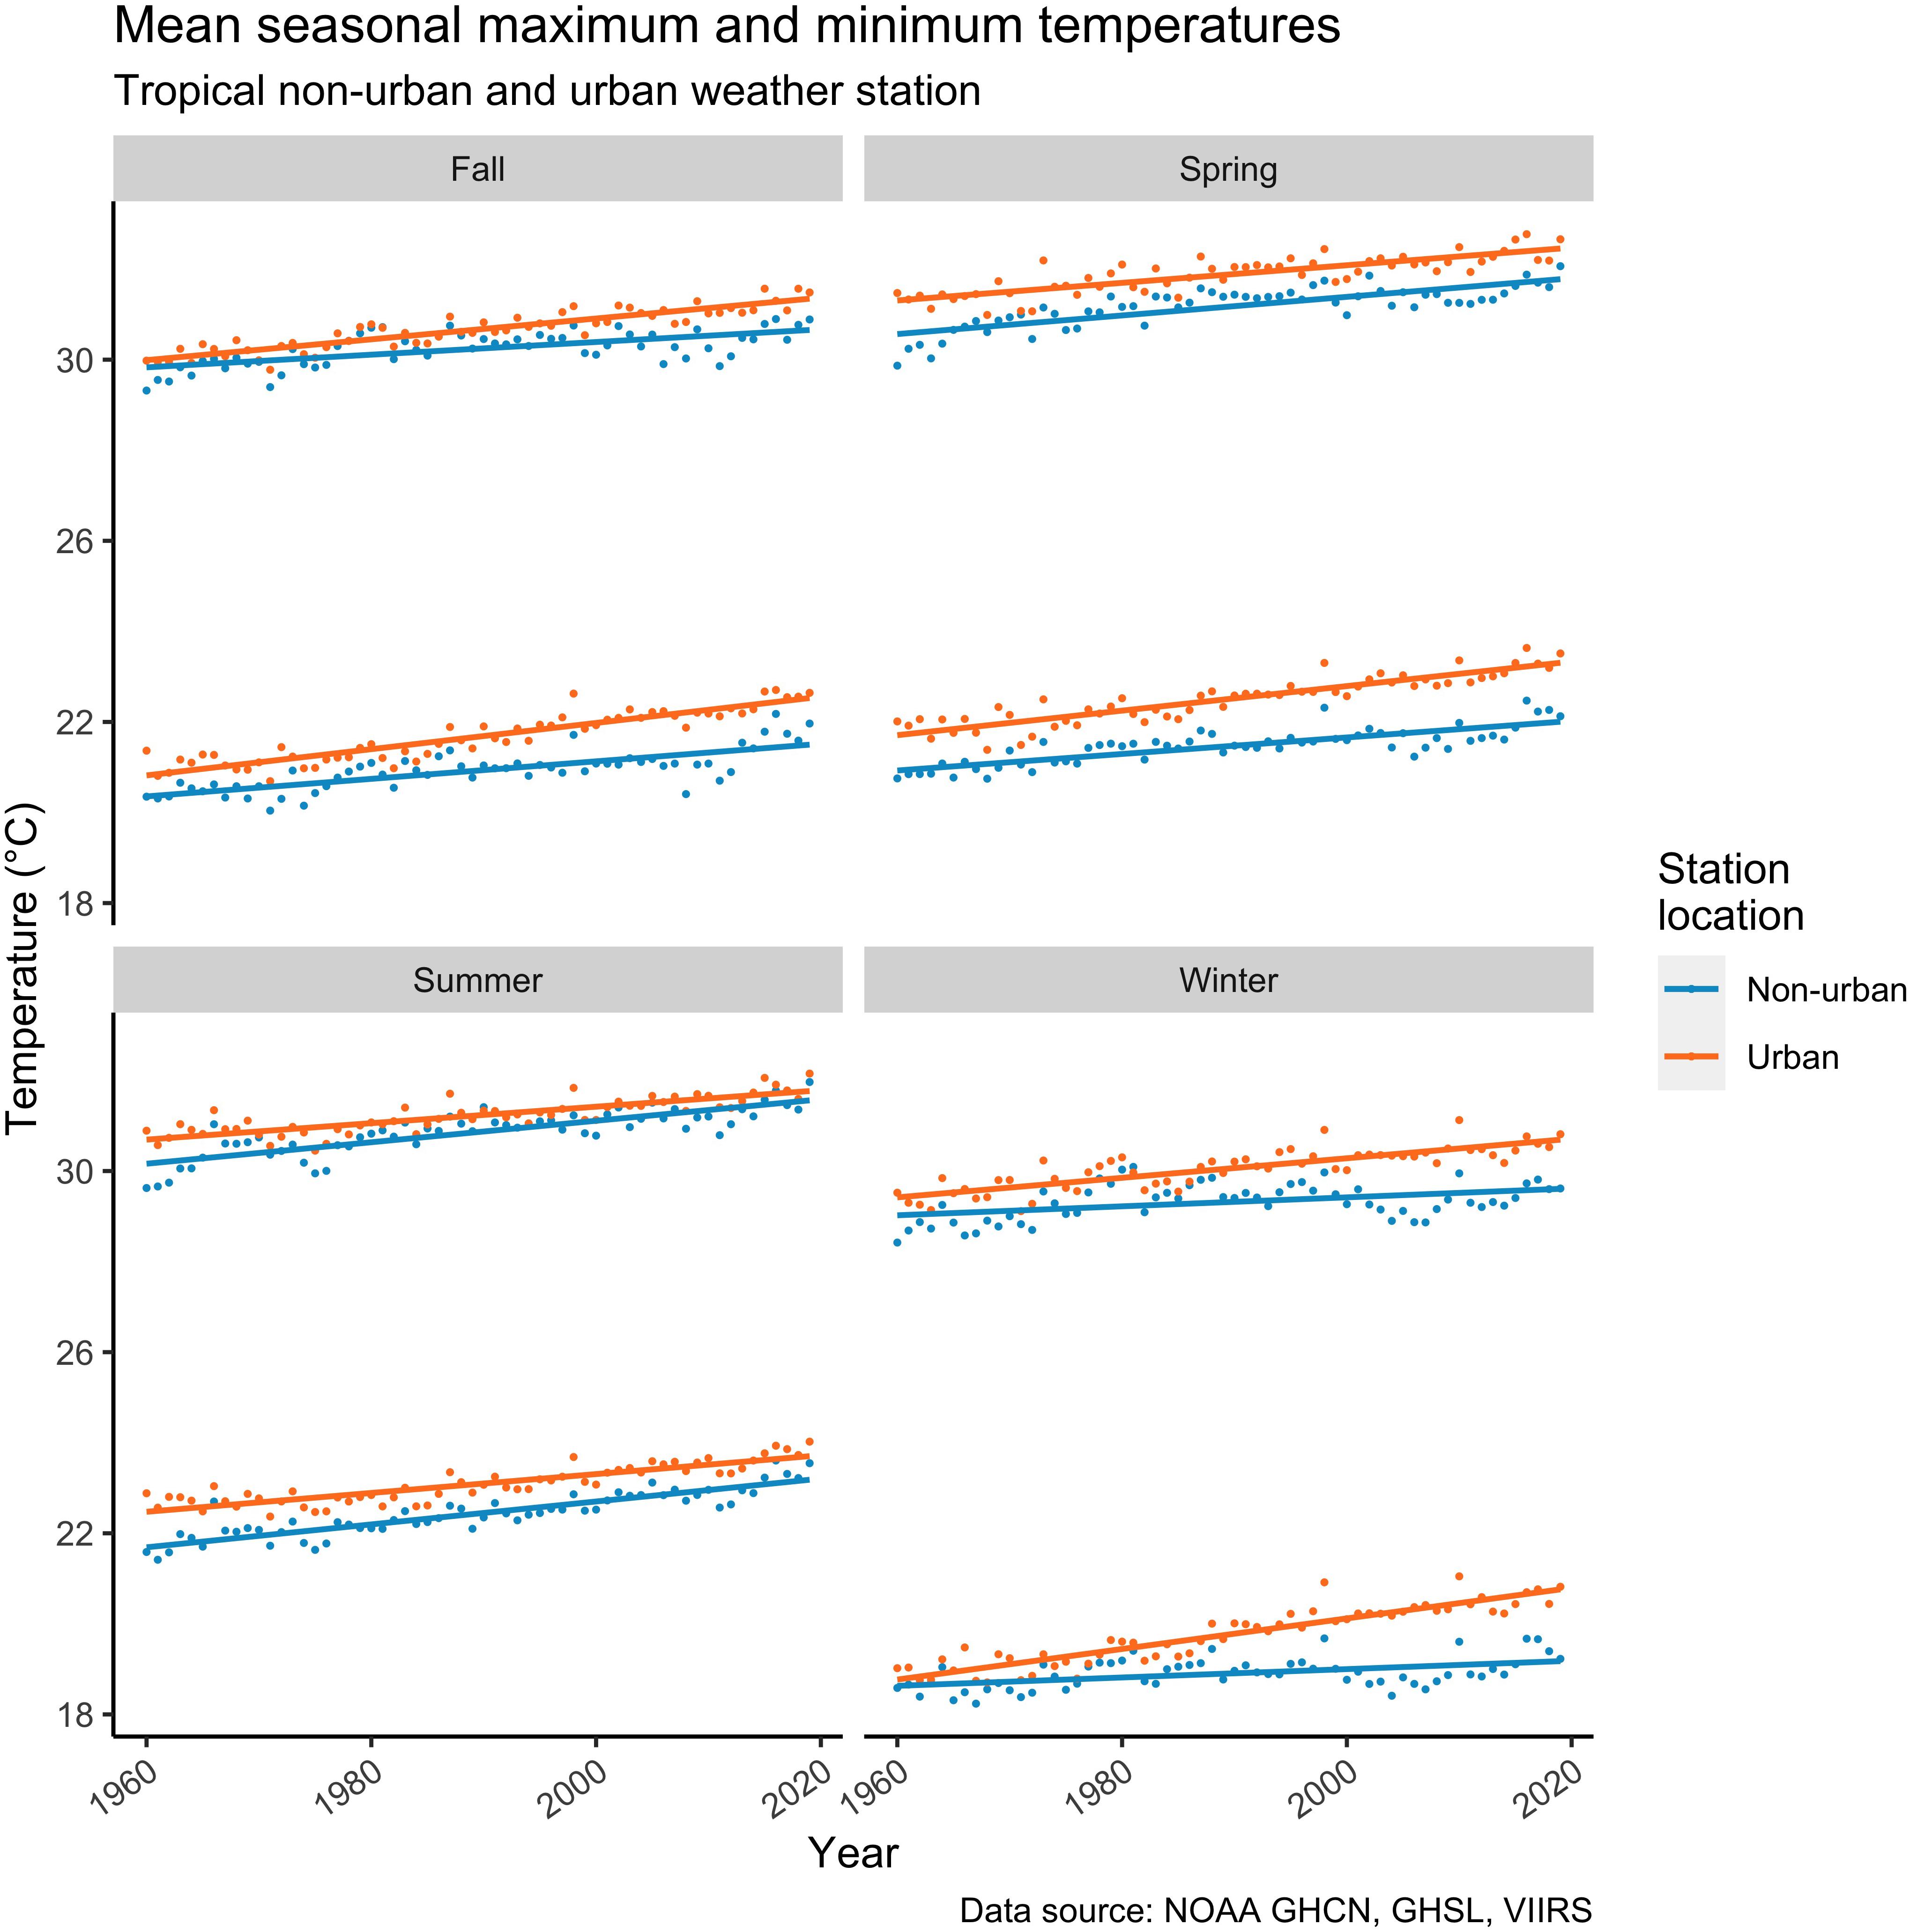
Figure 9. Mean seasonal maximum and minimum temperatures for urban and non-urban areas. The higher points and curves on each mini-plot represent the maximum temperatures and the lower points and curves represent the minimum temperatures. Data source: NOAA, GHCN.
Examining the differences across both climate zone and seasons suggests the largest urban warming effect is during the winter for tropical rainforest zones and the spring and fall for monsoonal zones (Figure 10). During the winter season for tropical rainforest zones, the urban warming effect increased maximum temperatures by 0.082°C per decade and increased winter minimum temperatures by 0.086°C per decade. Monsoonal zones experienced an urban warming effect of 0.232°C per decade for maximum temperatures and 0.272°C per decade for minimum temperatures. During the fall season in this zone, urban areas recorded a warming effect of 0.178°C per decade for maximum temperatures and 0.247°C per decade for minimum temperatures. Wet-dry savanna zones also experienced an urban effect but this was largely in the winter, where maximum temperatures rose at 0.015°C higher than non-urban areas per decade and minimum temperatures rose by 0.195°C per decade more than non-urban (Supplementary Table 4).
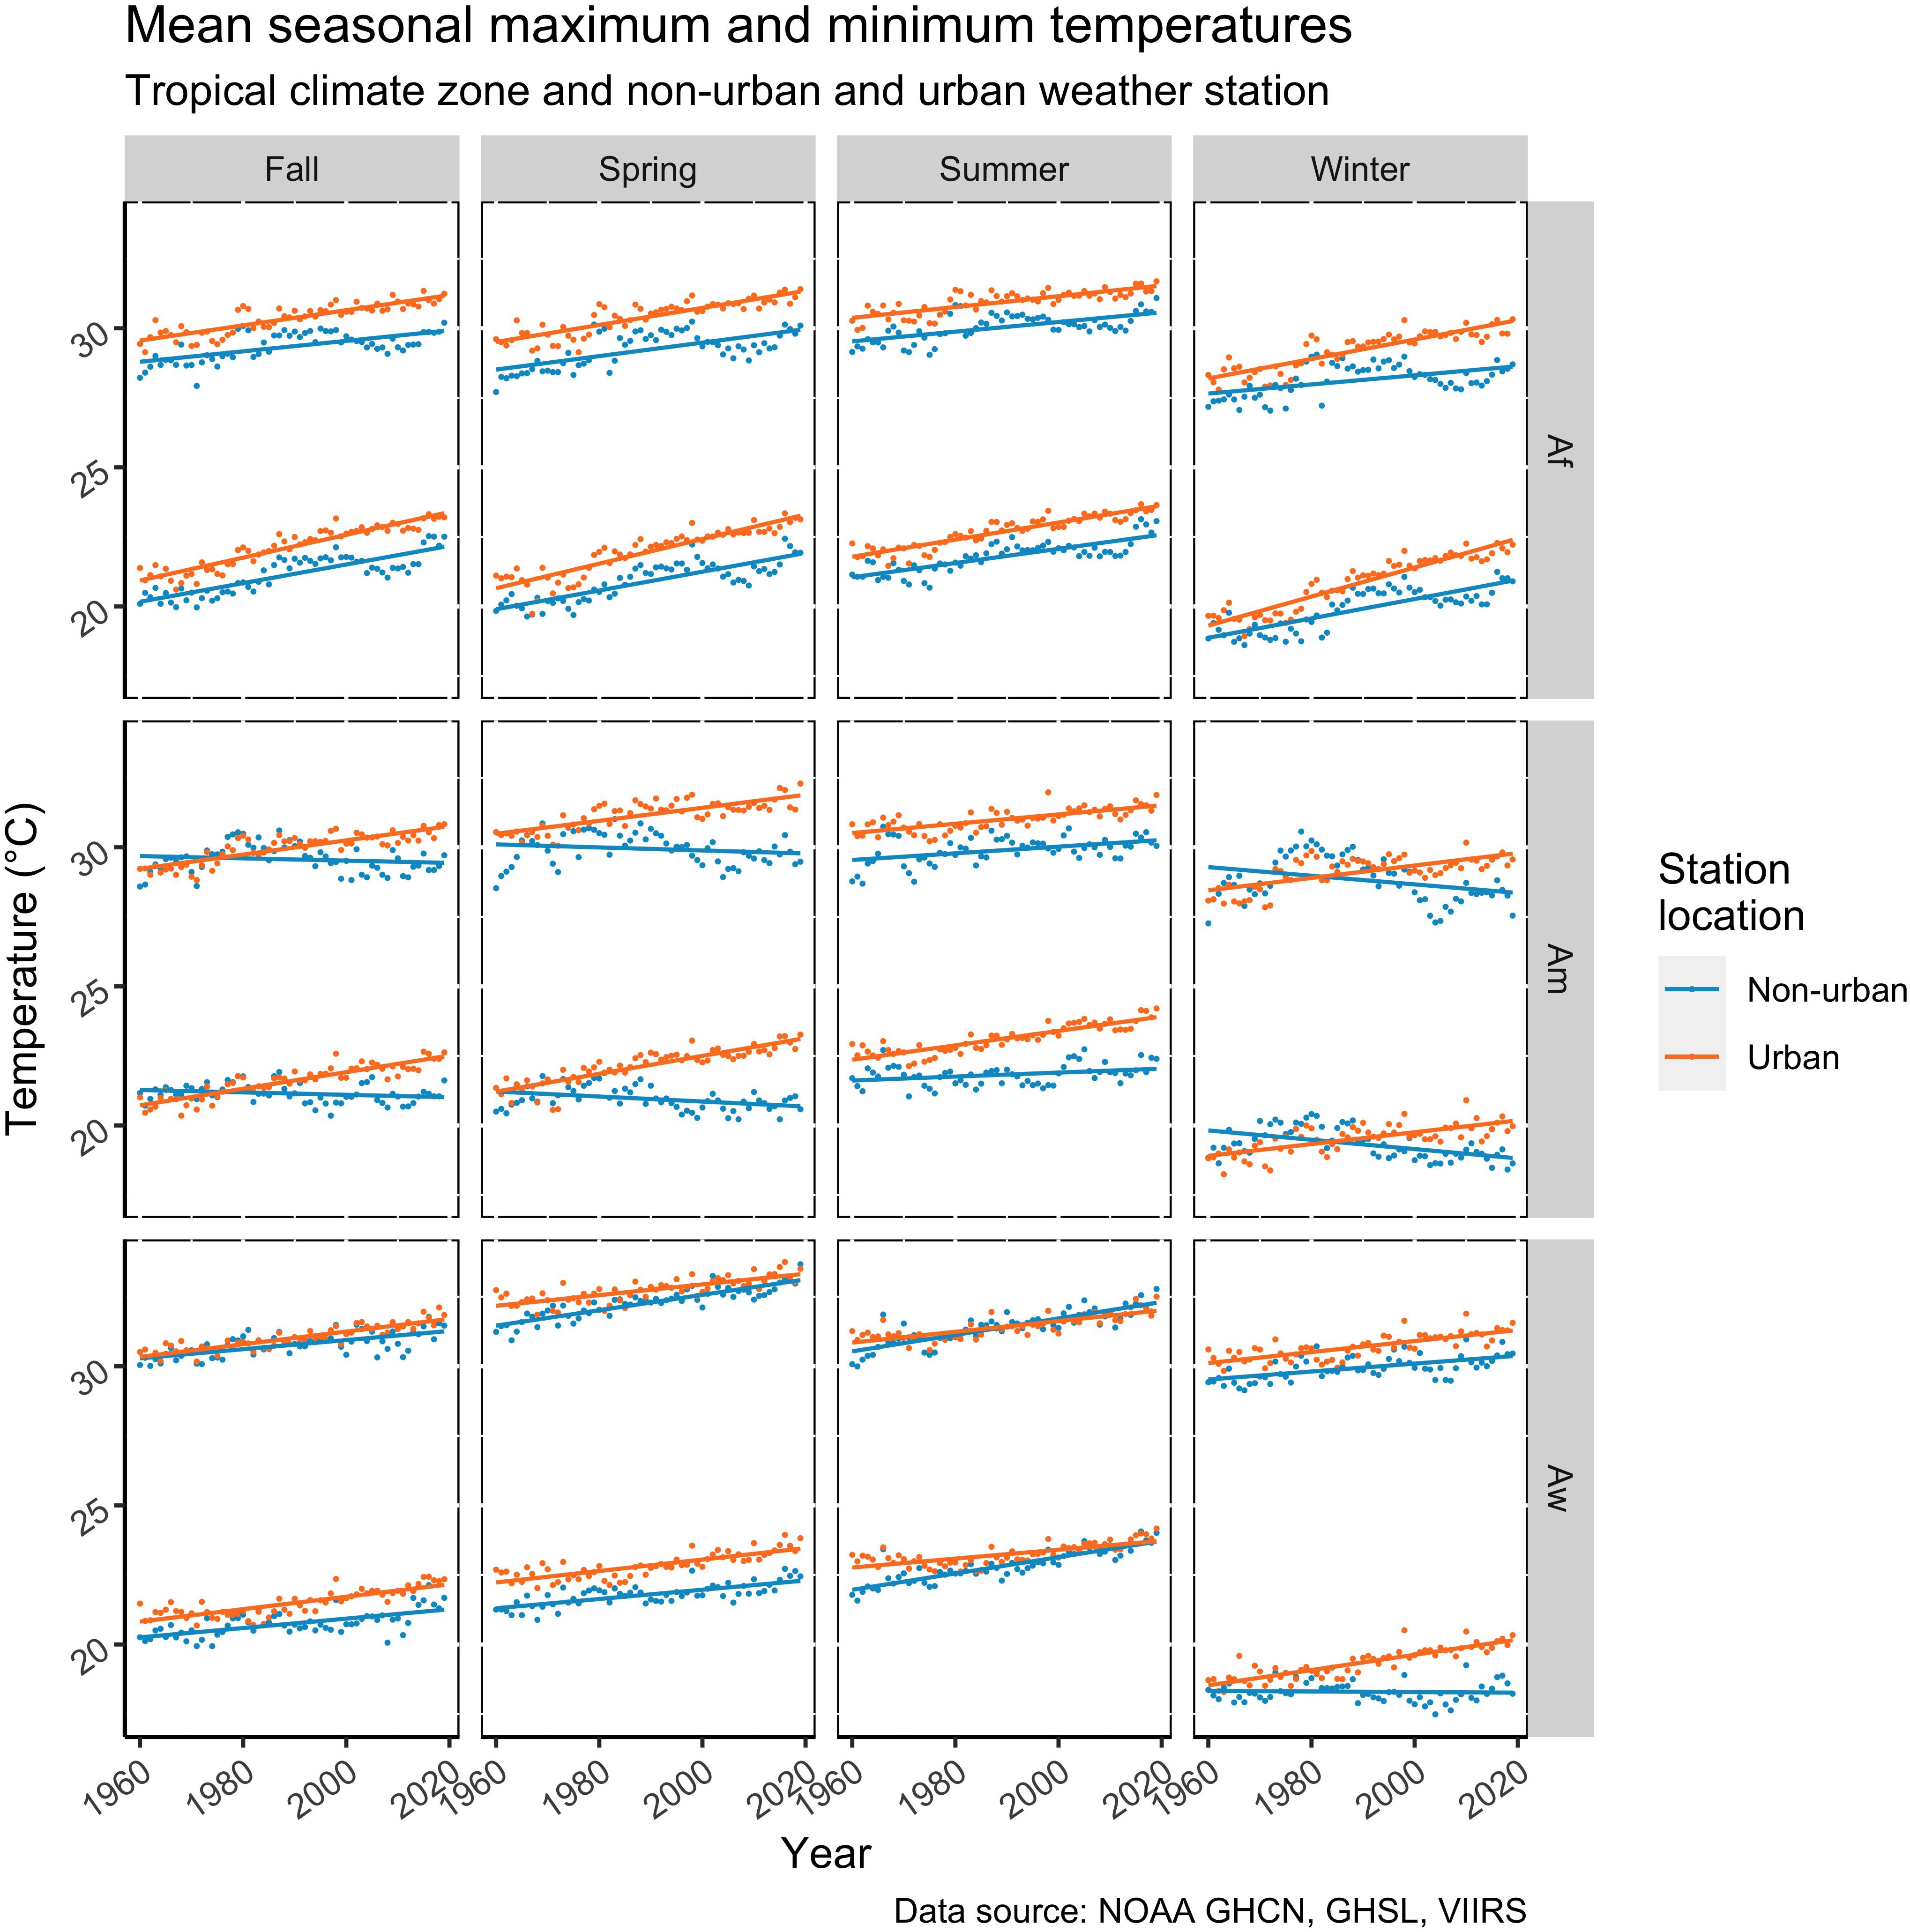
Figure 10. Mean seasonal maximum and minimum temperatures for urban and non-urban areas by tropical zone. The higher points and curves on each mini-plot represent the maximum temperatures and the lower points and curves represent the minimum temperatures. Data source: NOAA, GHCN.
Factors Associated With Differences in Urban Warming
Having established a difference in temperatures between urban and non-urban areas and an urban warming effect over time, the analysis turned to an exploration of factors associated with the higher levels of temperatures along urban gradients. The gradients include total urban population size, urban population density and urban infrastructure and each are associated with temperature change. The analysis presents each individual effect and then a comparison of the strength of factor’s relationship to temperature change through comparing OLS multivariate regressions coefficients. In the final section we explore the role of intra-urban form on temperature.
Urban Population Size and Temperature
Annual median maximum and minimum temperatures differ by urban population size (Figure 11). Generally, the largest quantile size cities have minimum temperatures approximately 0.4°C higher than those in the lowest quantile. However, there was no increase in maximum temperatures found across population size quantiles. In fact, within our data sample, median maximum temperatures remained fairly even across all population sized urban areas (Supplementary Table 5). Differences among quantile sizes were small but evident across climate zones. In rainforest climates, urban areas in the highest 25% quantile have a higher maximum of 0.29°C and higher minimum of 0.88°C than those in the lowest population size quantile. In wet-dry savanna climates, urban areas in the highest 25% quantile have a higher maximum temperature of 0.47°C and higher minimum temperature of 0.57°C than those in the lowest population size quantile. There are no increases in temperatures with urban population size in monsoon climates in this data base.
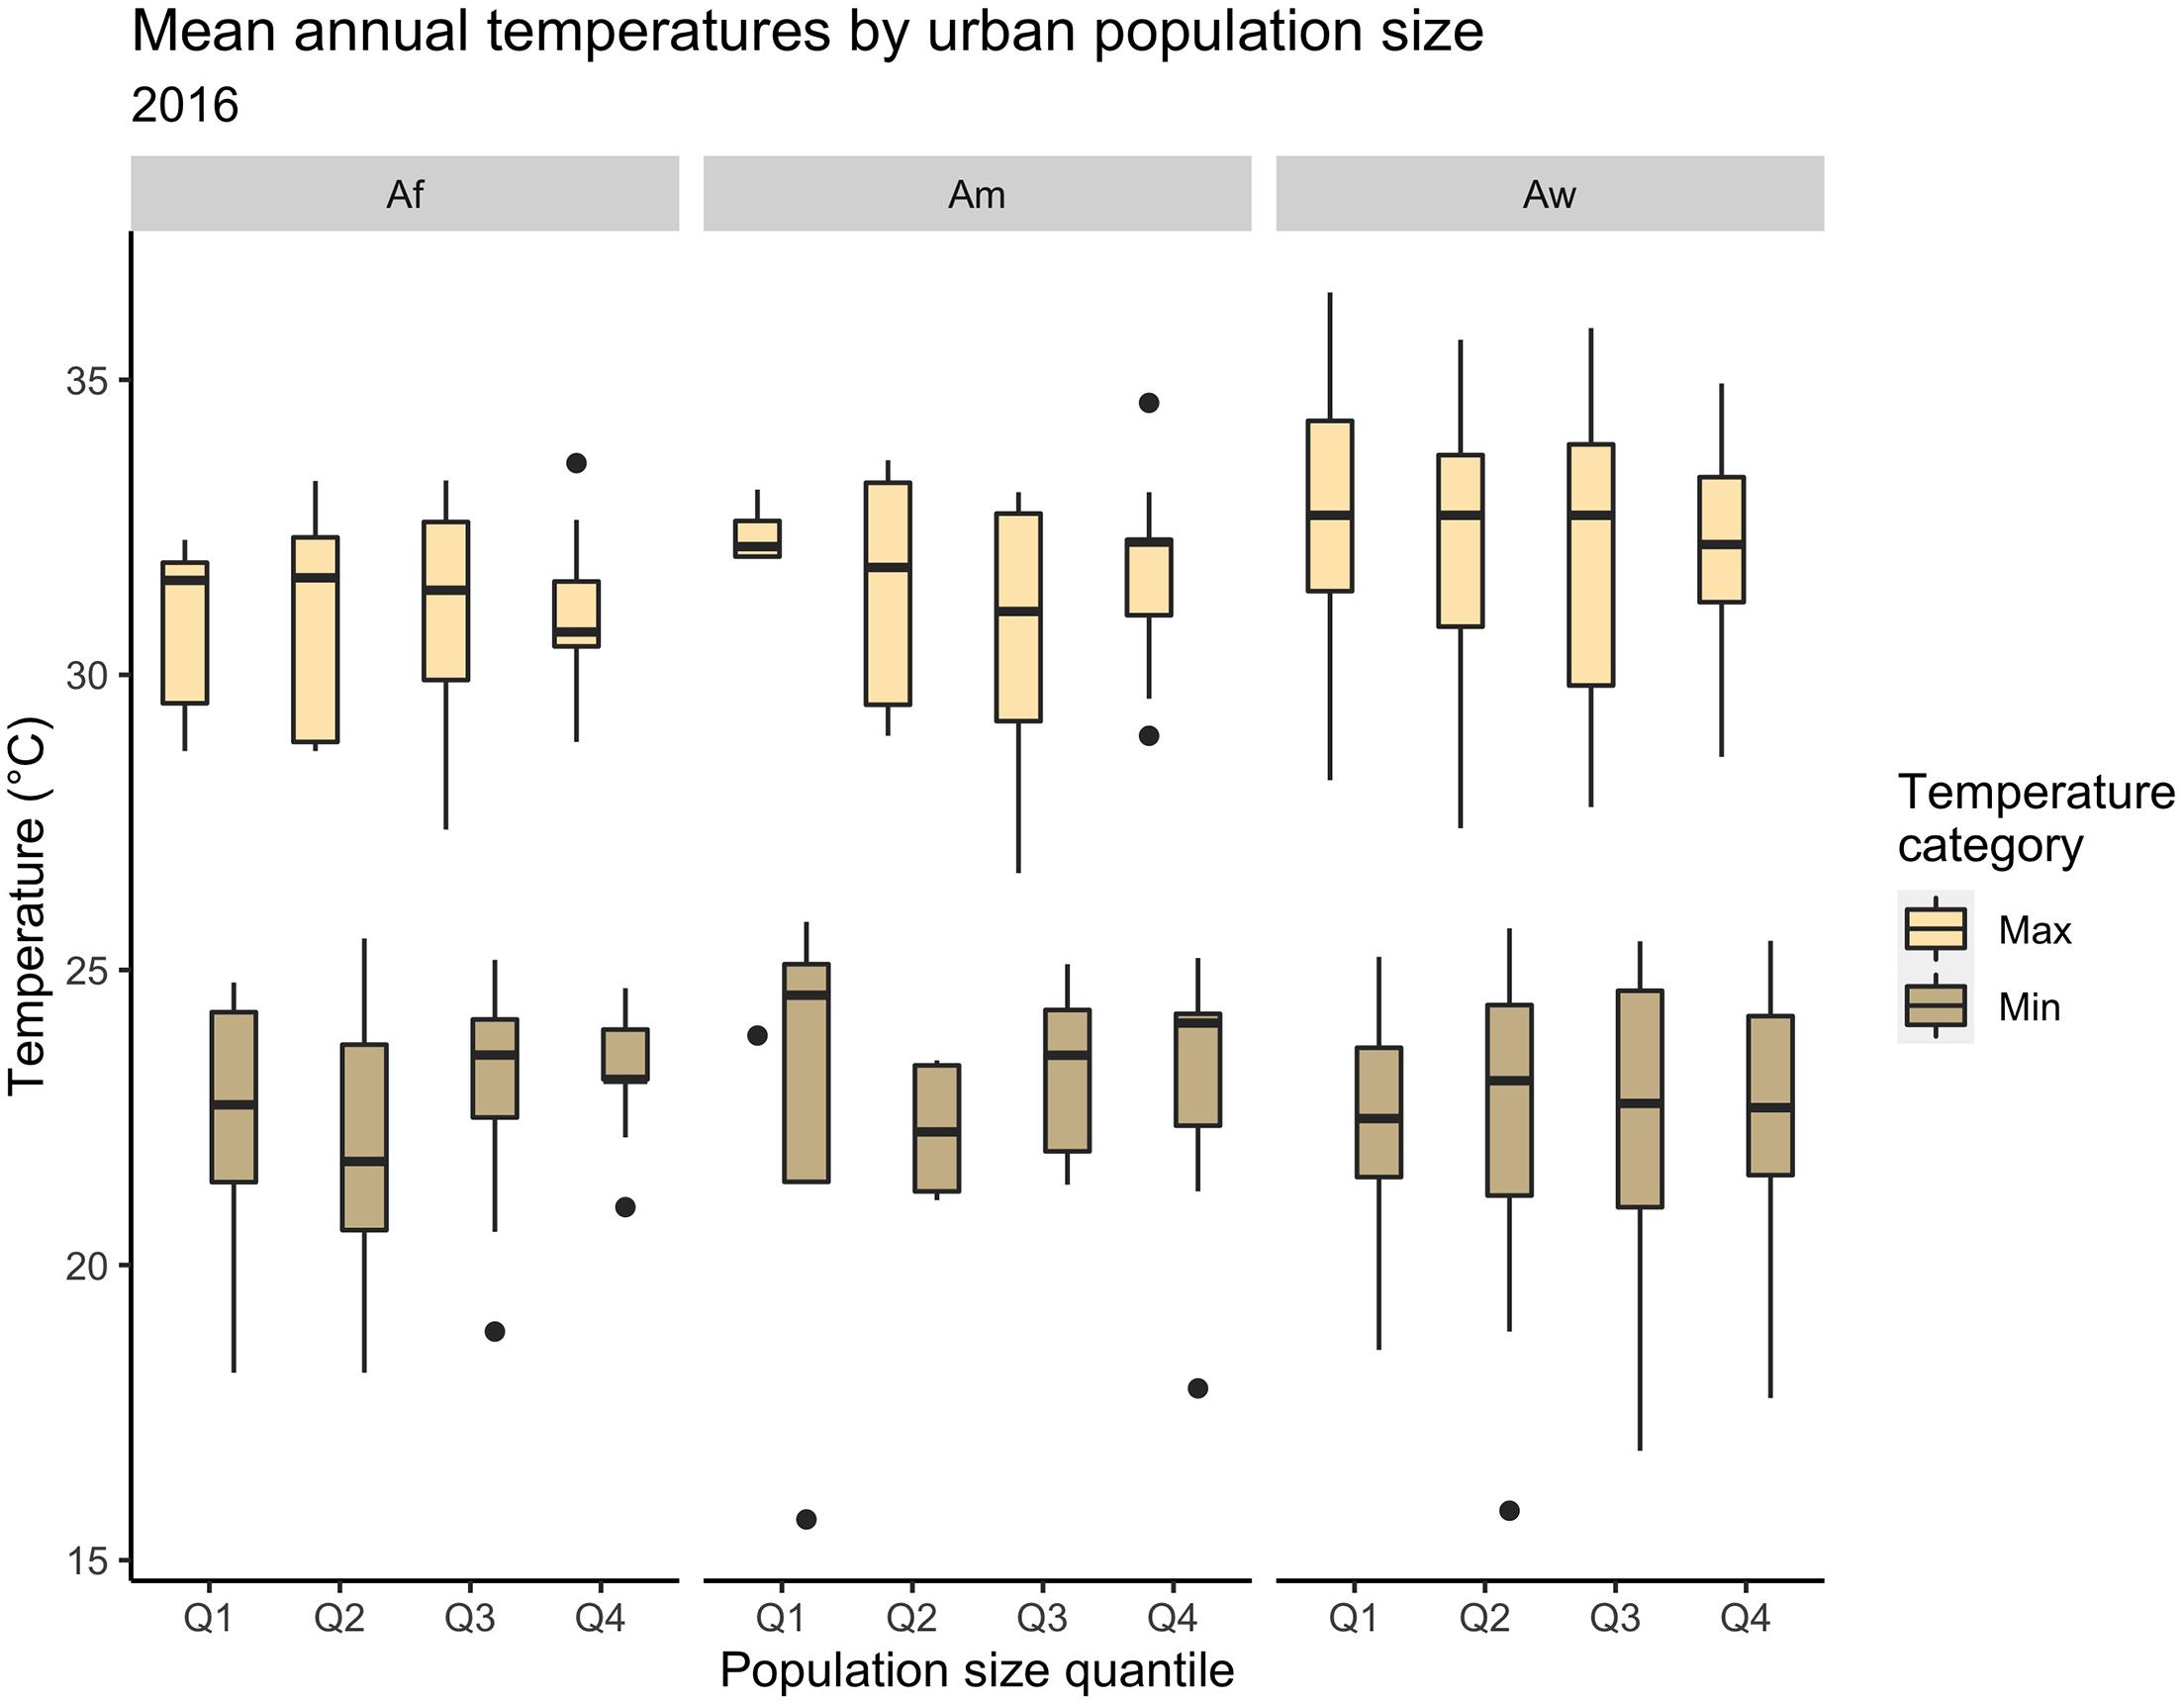
Figure 11. Mean annual temperatures across urban population size gradients. Data source: NOAA, GHCN and UN, 2018.
Urban Population Density and Temperature
Alternatively, there are clear temperature differences across urban population densities (Figure 12). In this case, trends are evident across both median, maximum and minimum temperatures for quantiles of densities. The greatest increases associated with population density can be seen in monsoon and rainforest zones in both maximum and minimum temperatures. For example, moving from the lower 25% population densities to the highest 25% population densities in the rainforest zones was accompanied by an increase in 2.0°C for median maximum temperatures and 2.5°C for median minimum temperatures. Urban densities are associated with the changes of 2.9°C and 2.7°C for maximum and minimum temperatures, respectively, moving from the lowest population density to the highest urban population density areas in the monsoonal climates. In the wet-dry savanna climate, urban population density is associated with an increase of 1.6°C and 1.9°C moving from the lowest 25% urban dense areas to the highest 25% dense urban areas in maximum and minimum temperatures, respectively.
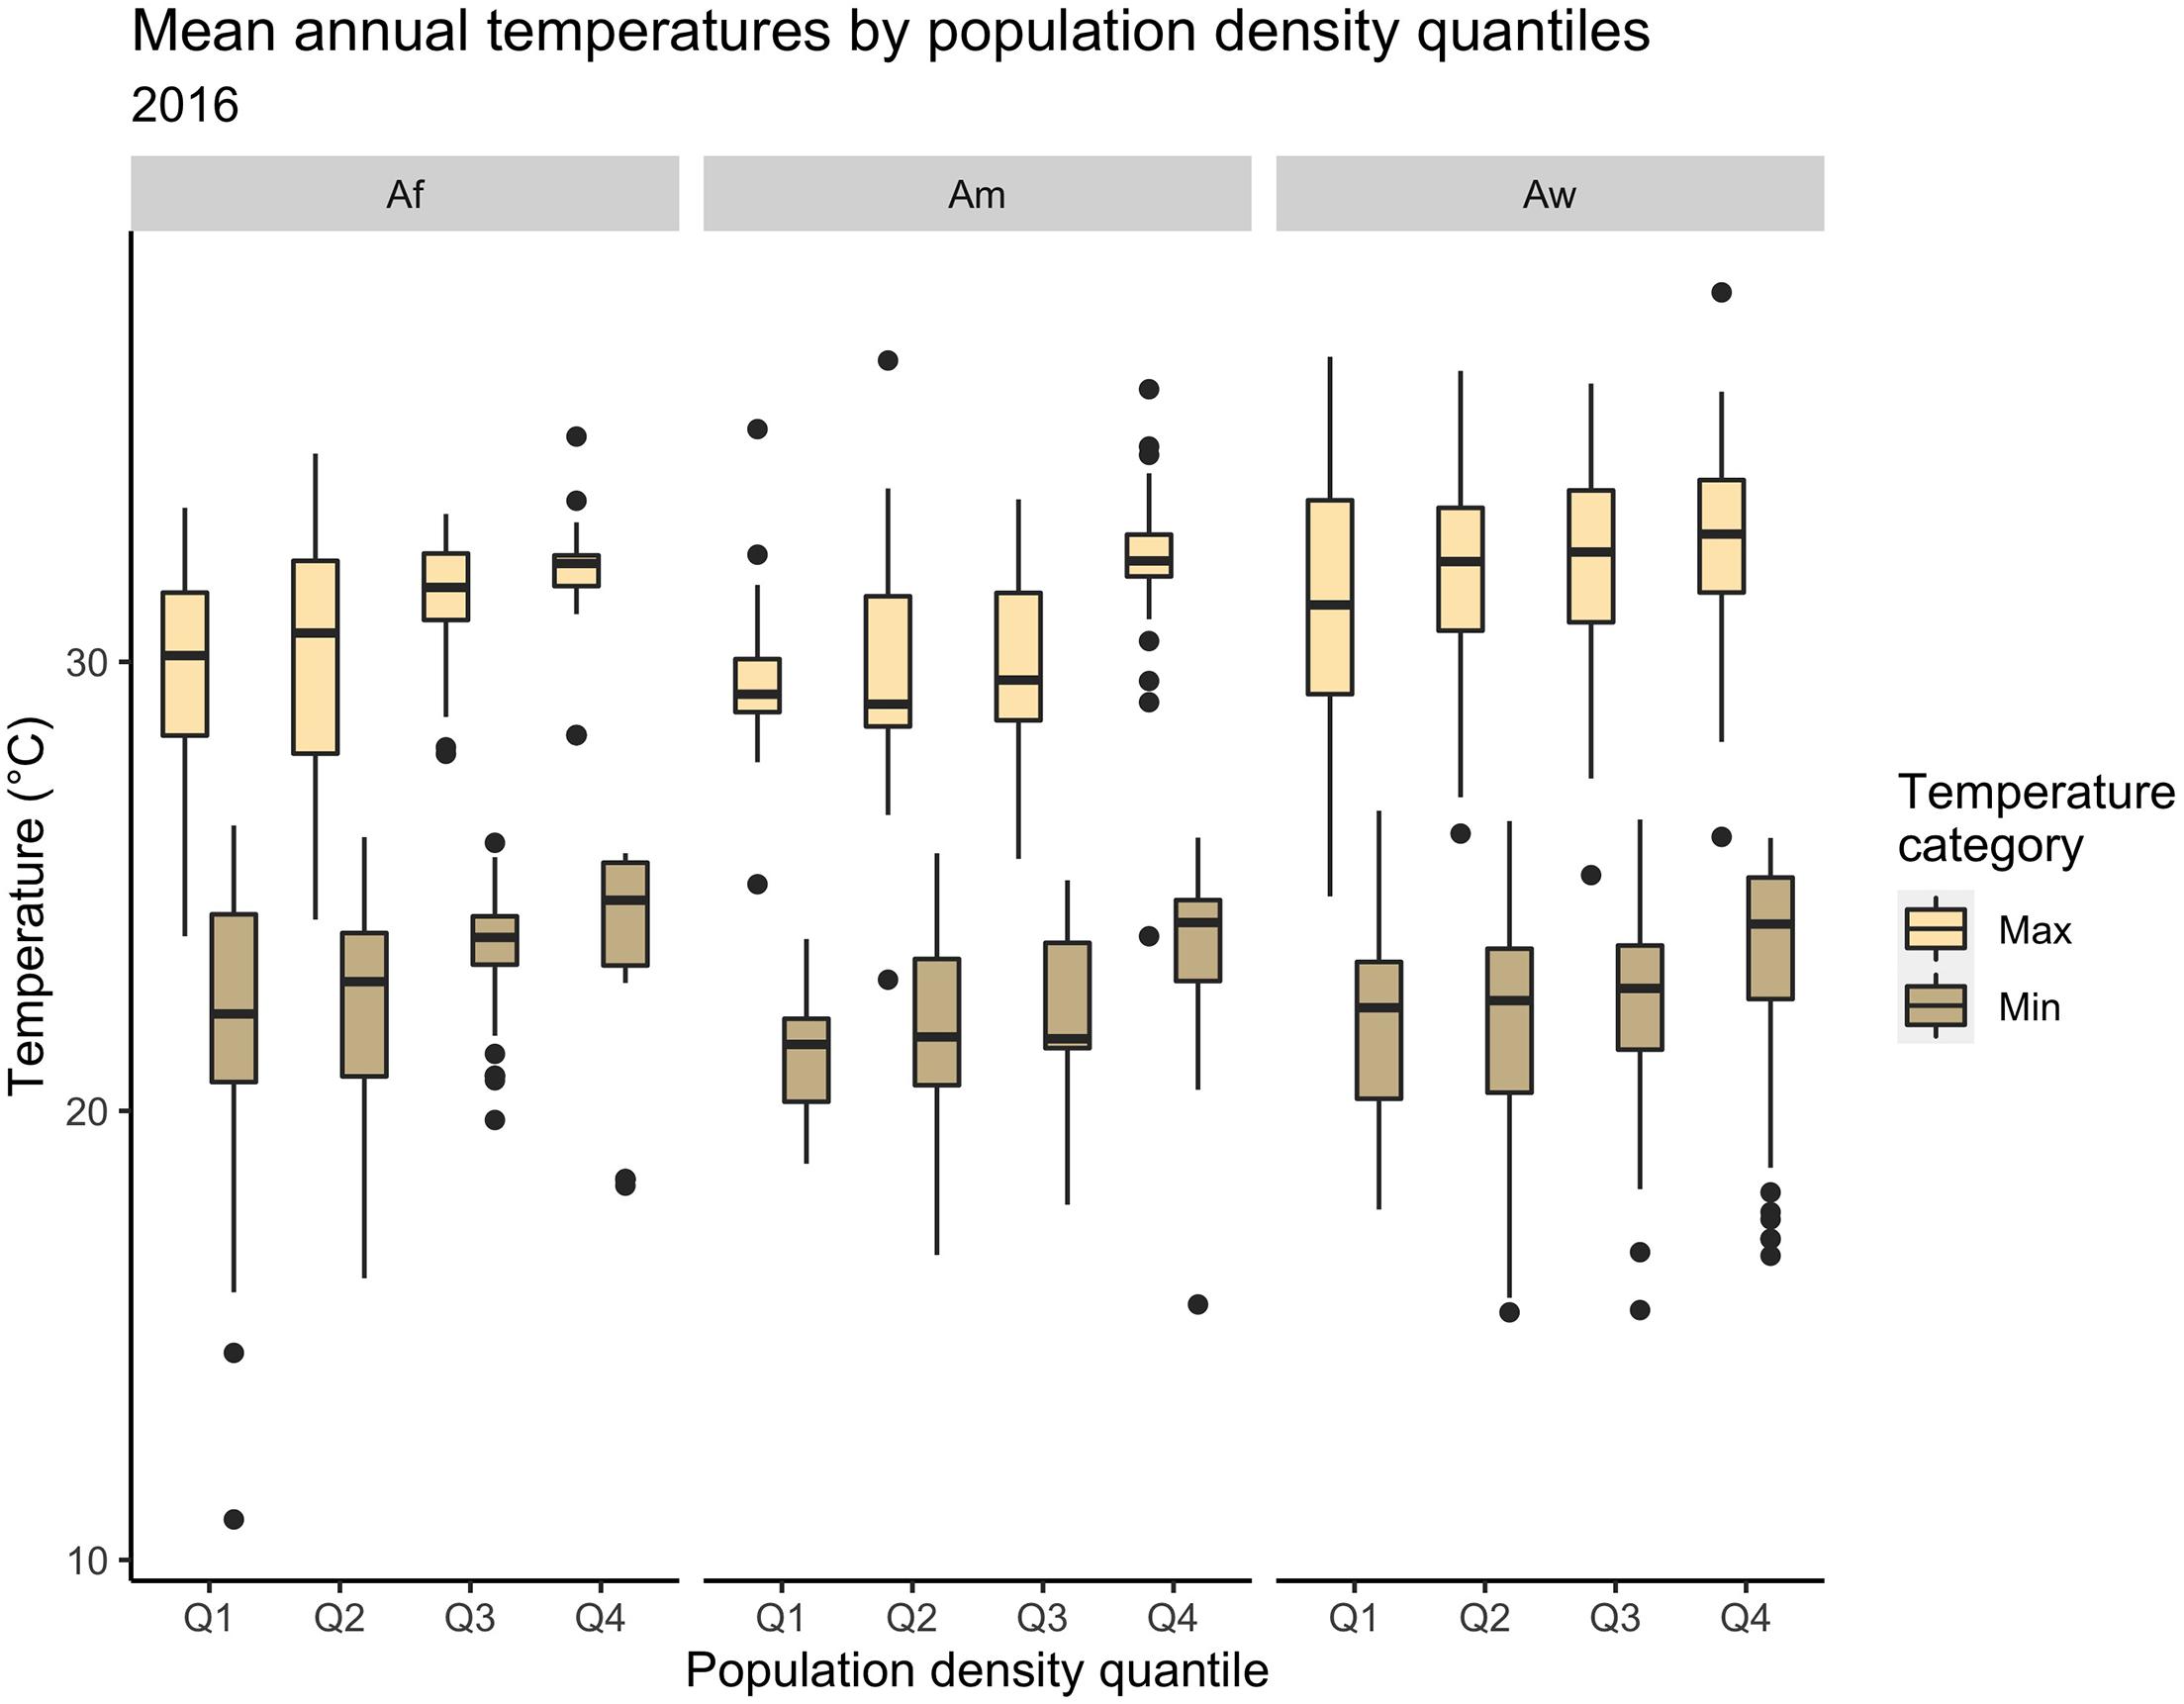
Figure 12. Mean annual temperatures across population density gradients. Data source: NOAA, GHCN and GHSL.
Urban Infrastructure and Temperature
As mentioned we use the nighttime lights dataset as a proxy to represent an infrastructure gradient. The data suggests that over the time, the number of weather stations in tropical zones surrounded by low to no radiance has decreased, while those in higher radiance areas have increased. The relationship between radiance values and temperature suggests values in-between those of population density and population size. According to these data, maximum and minimum temperature values increase with radiance values by around 0.5°C when moving from the 25% lowest radiance values to the highest 25% radiance values (Figure 13). The greatest increases across quantiles are in the tropical rainforest zones. In this case, there is a 1.02°C increase across the gradient of radiance quantiles for maximum temperatures and 0.88°C across the radiance gradient for minimum temperatures. There was no identified difference across radiance gradients for monsoonal zones. In wet-dry savanna zones, there was a 0.47°C and 0.57°C increase in temperatures across radiance gradients for maximum and minimum temperatures, respectively.
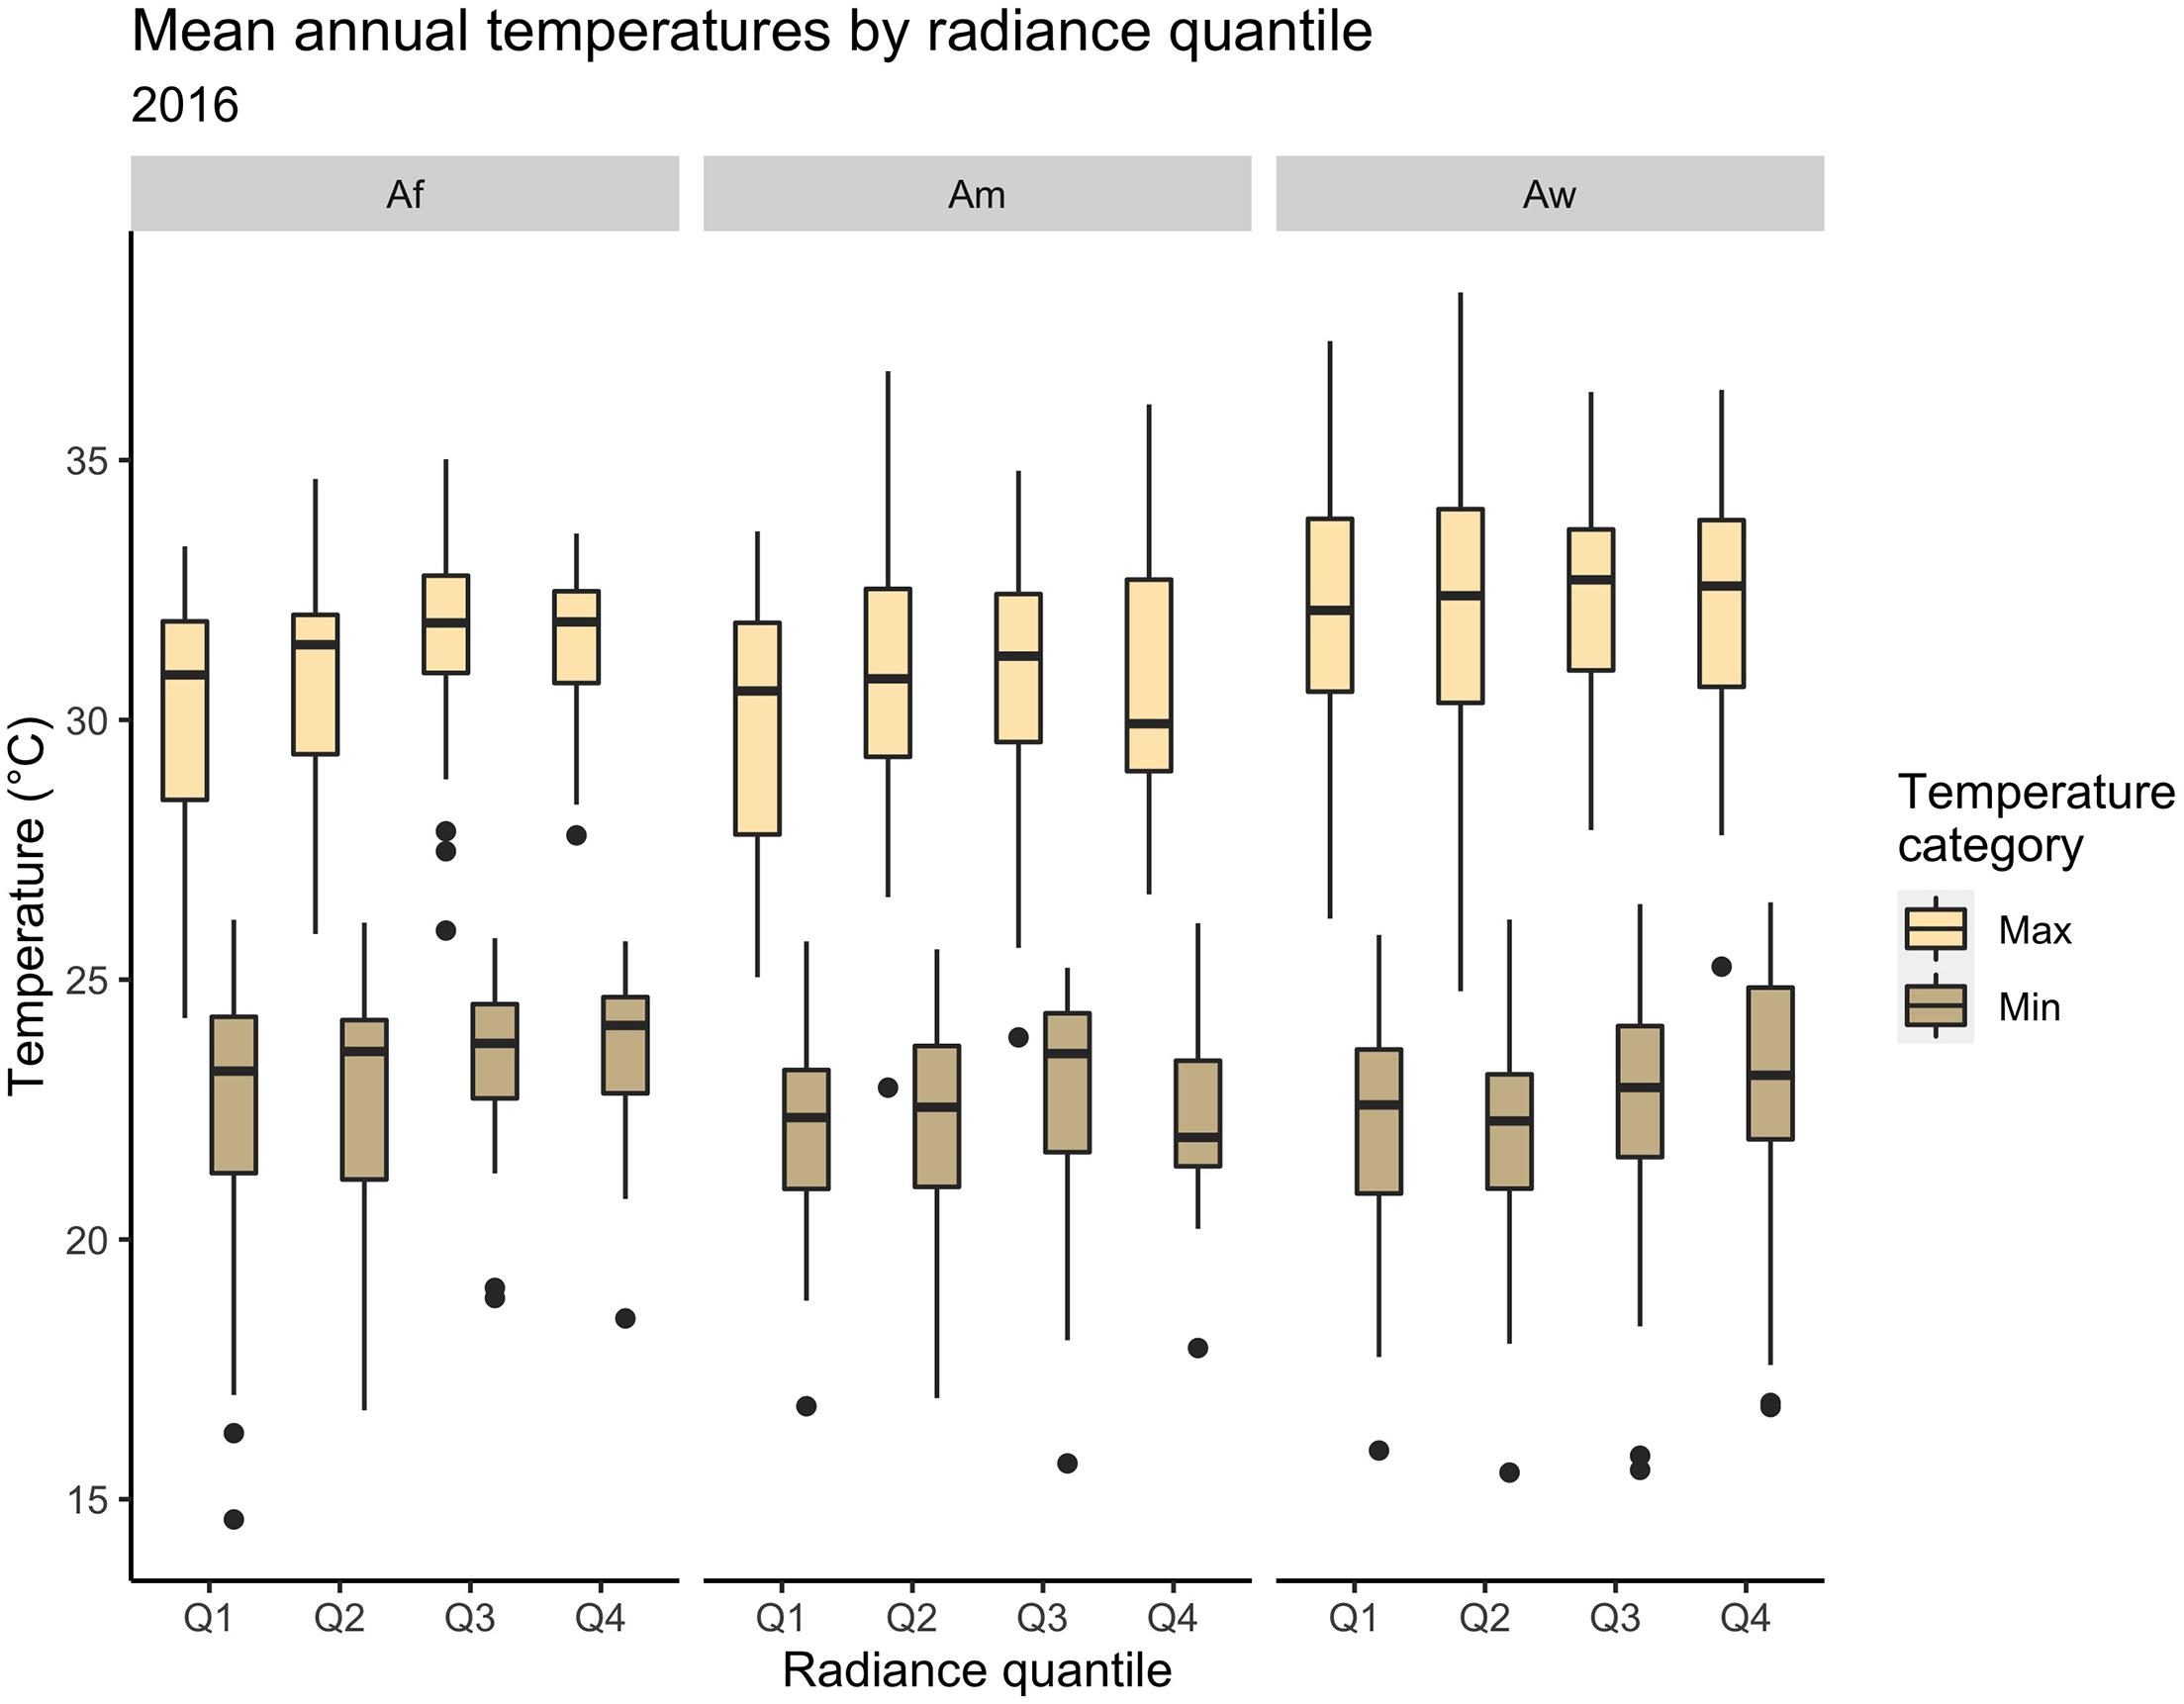
Figure 13. Mean annual temperatures across nighttime lights radiance gradients. Data source: NOAA, GHCN and VIIRS, 2016.
Comparison of Associated Factors
The analysis suggests that temperatures (both daily minimum and maximum) have risen from 1960 to 2020 in and around tropical cities, but that the changes have been different based upon the tropical zones. Total population, population density and infrastructure are all associated with these changes in temperature maximums and minimums and the warming effects on minimums were greater than those on maximums. Across the different urban gradients, the greatest effect on temperatures is attributed to population density.
To examine which proxy is the most important predictor of temperature changes we built two multivariate regression equations, one without interactions and one with interactions. The predictors for the equations include the categorical variable for tropical climate zone and the continuous variables for indicators (population size, population density, and radiance). Each of these predictor variables were scaled into z-scores prior to the analysis. The dependent variable was either the maximum or minimum temperature. The results suggest that population density is the most important factor in temperature change overall, particularly in tropical rainforest and monsoonal climates. Infrastructure is the most important factor in wet-dry savanna tropical zones (Table 1). Note that population size has a negative correlation with temperature. This is largely due to the high temperature levels found in the smaller monsoonal and wet-dry savanna cities (see Figure 11). Aggregating these cities flattens the relationship (see Supplementary Table 5). This suggests that population size may not be a good predictor of changes in temperature, when combined with these other factors. This is an interesting result, but needs further detailed study.
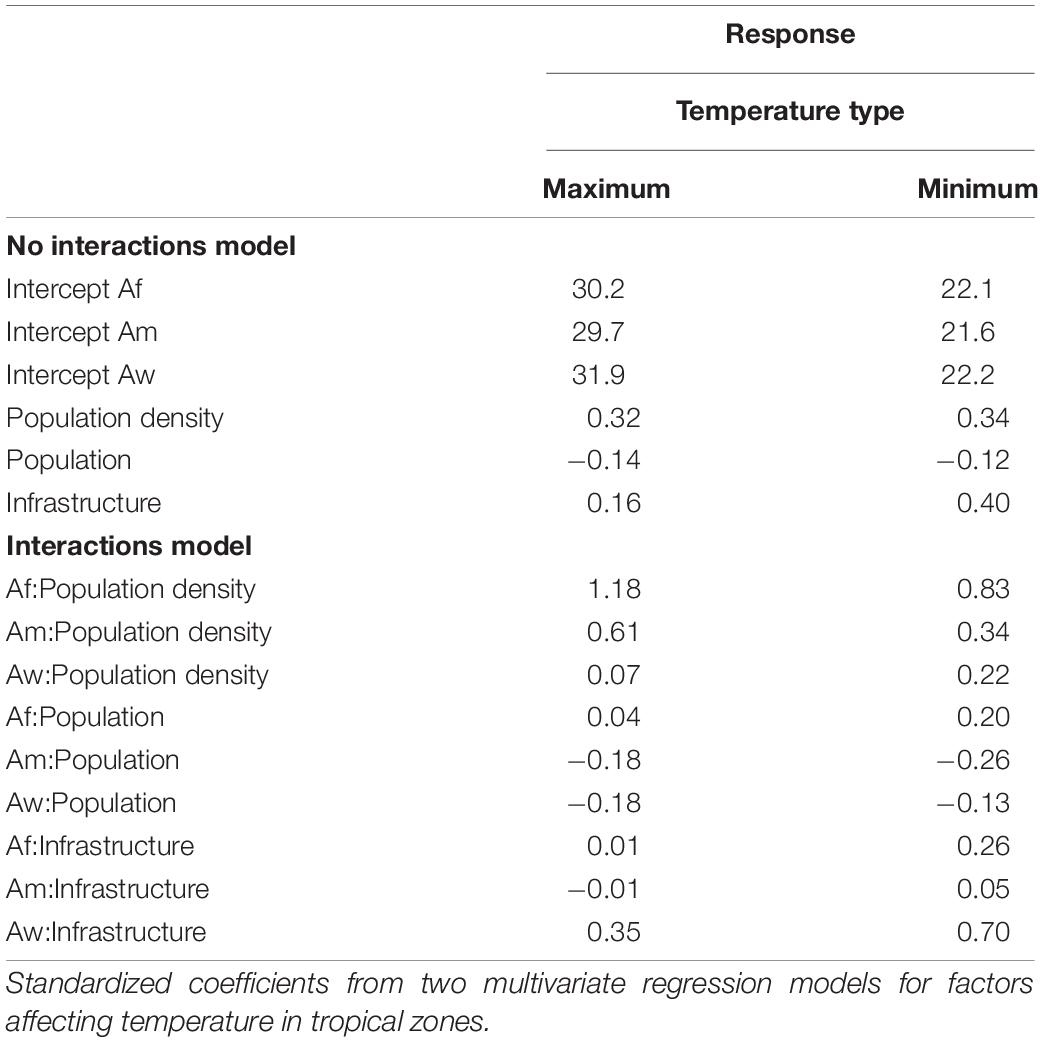
Table 1. Standardized coefficients.
Urban Form and Temperature in Urban Areas
The temperature data for different land use zones (LCZs) was only available for cities in tropical rainforest and tropical wet-dry savanna zones. The data demonstrates that those built-up zones (LCZs 1 – 10) have higher maximum and minimum temperatures than areas of lower built-up urban forms (LCZs 101–104). However, the temperatures for built-up areas differs between zones. For example, in tropical wet-dry savanna cities, the compact mid-rise (LCZ = 2), compact low-rise (LCZ = 3) and heavy industrial zones (LCZ = 10) have higher mean maximum temperature and mean minimum temperatures than those in open low-rise (LCZ = 6). In tropical rainforest cities, however, mean maximum temperatures were fairly similar across open low rise (LCZ = 6), open mid-rise (LCZ = 5), compact low rise (LCZ = 3) and sparse built (LCZ = 9). Alternatively, in tropical rainforest cites the lowest mean minimum temperatures were in sparse built zones (LCZ = 9). These locations were over 1.9°C lower than other areas, such as compact low-rise (LCZ = 3), open low-rise (LCZ = 6) and open mid-rise (LCZ = 5) zones (Figure 14).
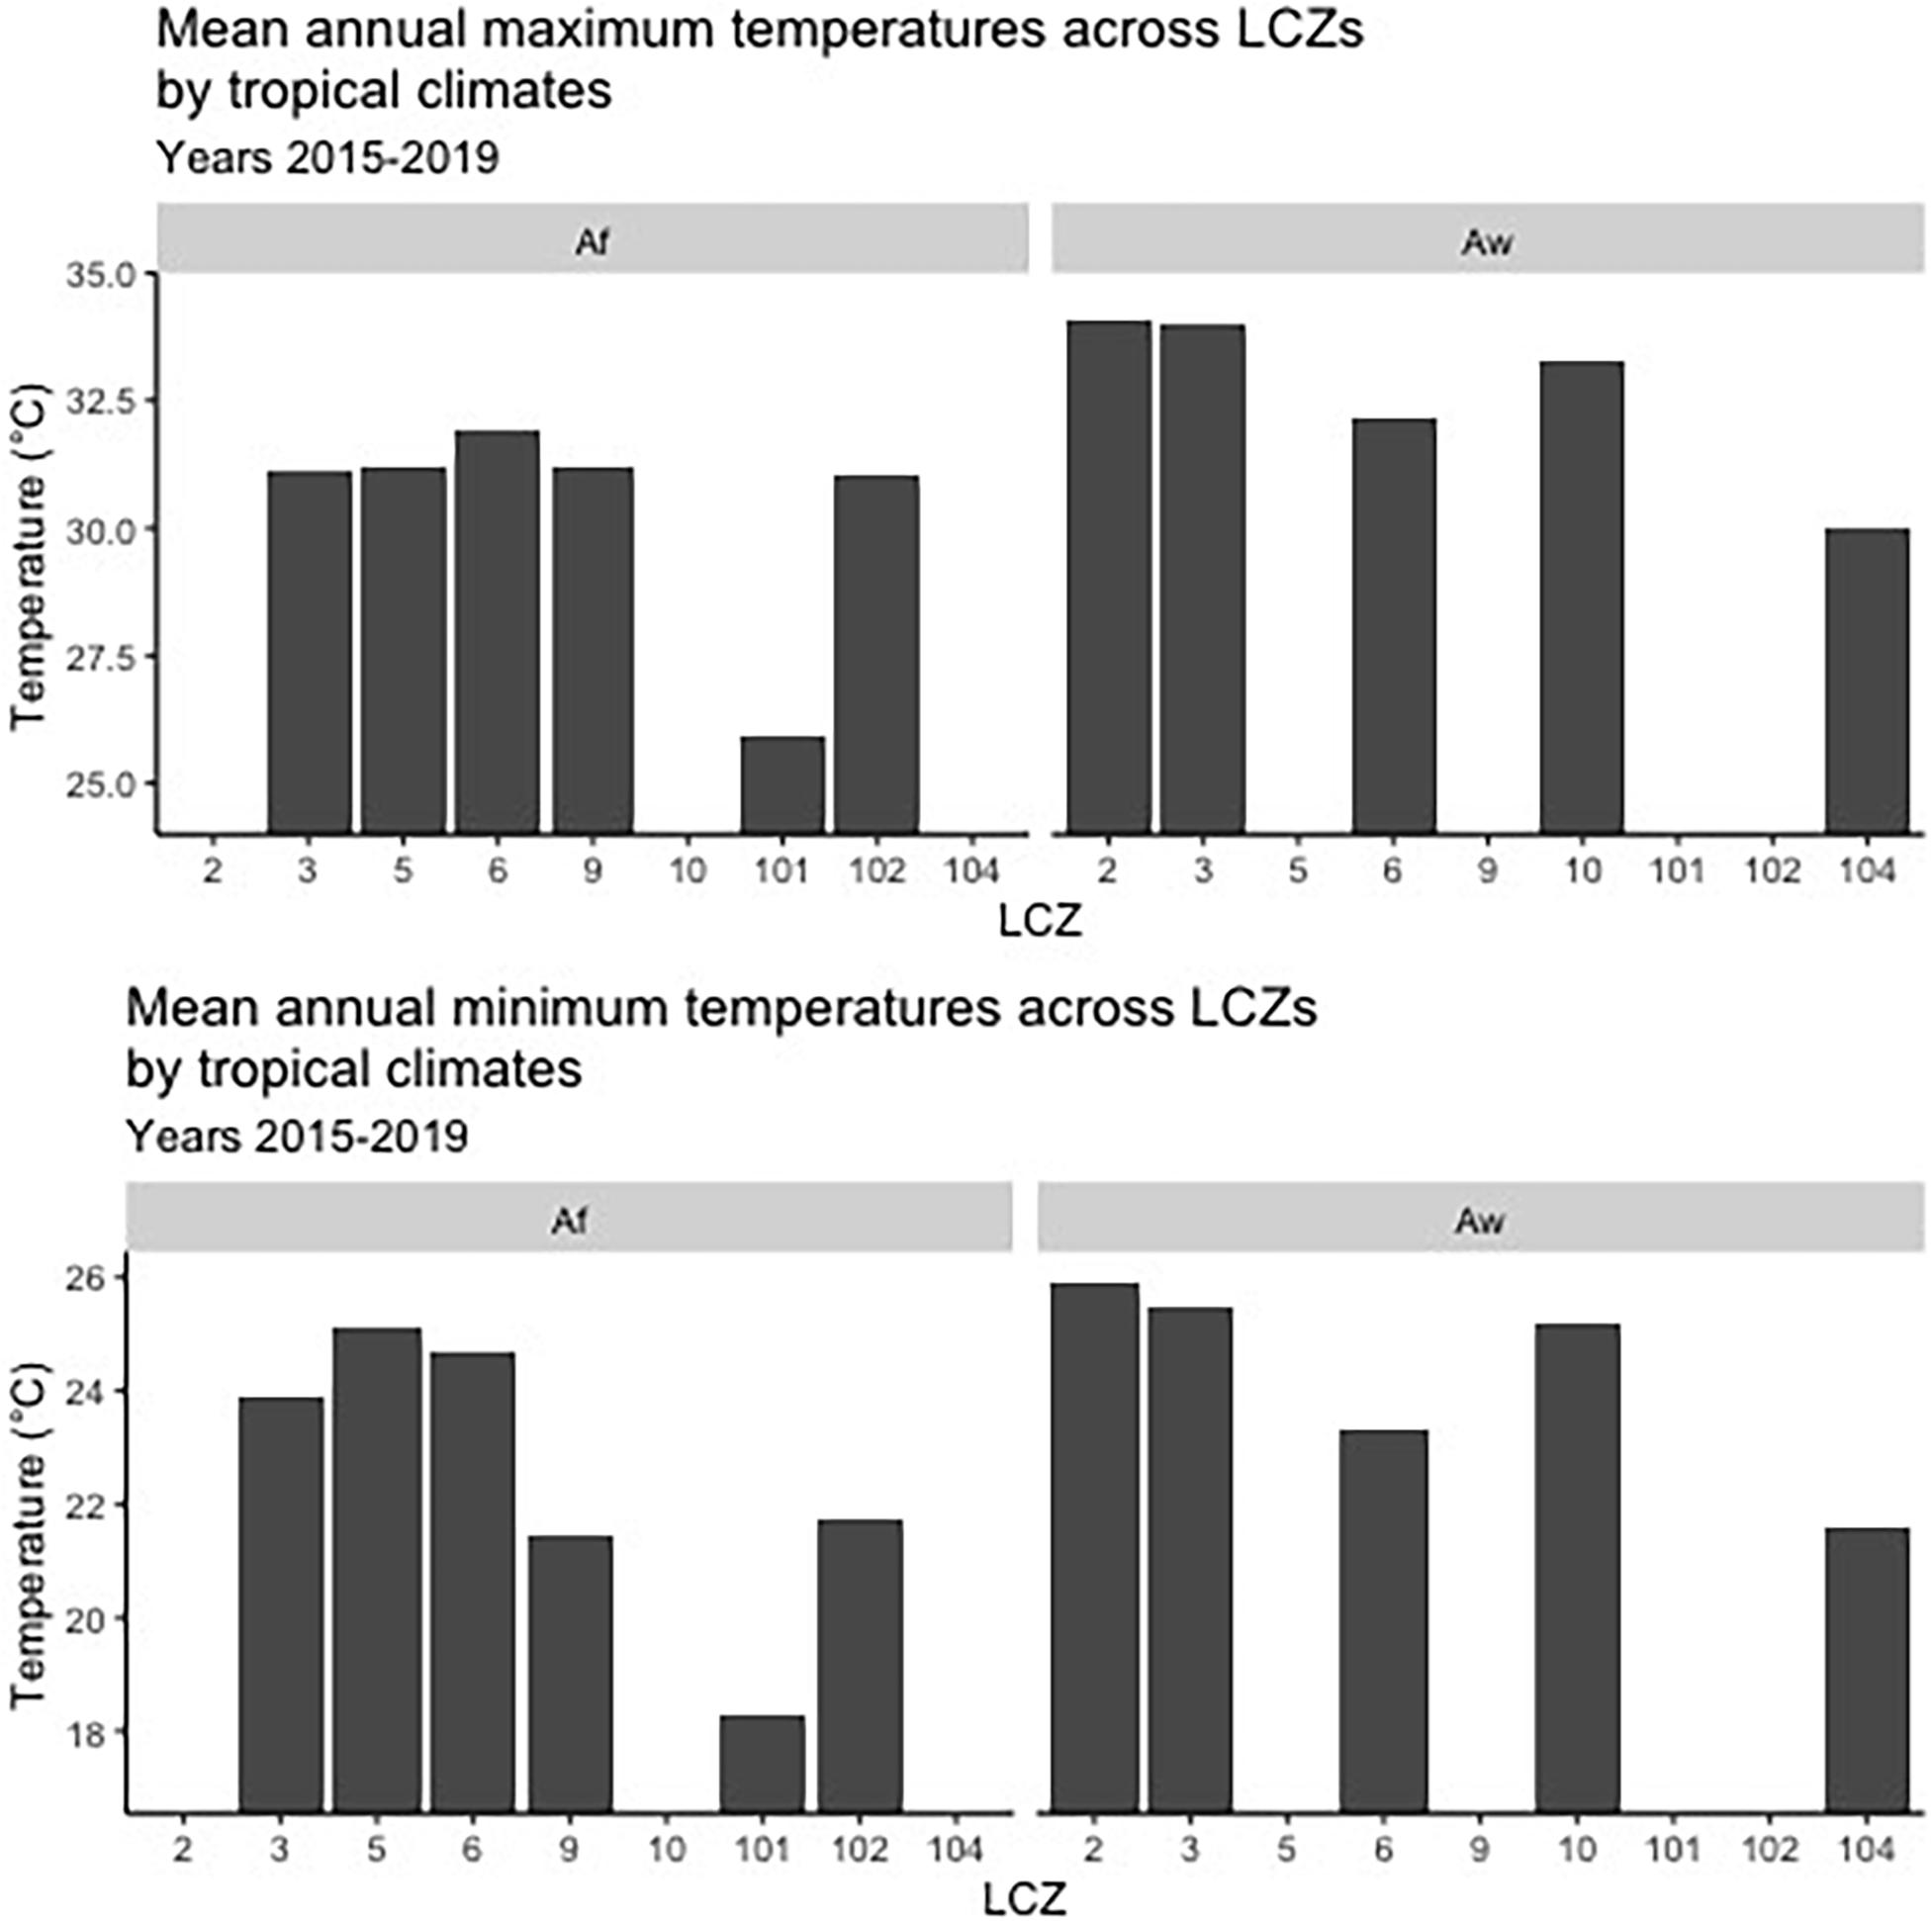
Figure 14. Mean annual maximum and minimum temperatures across LCZs in tropical climates. Local climate zones values 1 = Compact high-rise, 2 = Compact mid-rise, 3 = Compact low-rise, 4 = Open high-rise, 5 = Open mid-rise, 6 = Open low-rise, 7 = Lightweight low-rise, 8 = Large low-rise, 9 = Spare built, 10 = Heavy Industry, 101 = Dense trees, 102 = Scattered trees, 103 = Bush, scrub, 104 = Low plants, 105 = Bare rock or paved, 106 = Bare soil or sand, 107 = Water. Data sources: NOAA, GHCN and WUDAPT.
Discussion
This section reviews the results in five parts. The first section compares our urban warming results to similar studies. The second part discusses the predictors of urban heat analyses and integrates our results with current debates. The third part reviews the potential role of ecosystem services in addressing increasing heat in tropical cities. The fourth part presents the implications of the results, and the final part presents the limitations to the research.
Changes in Temperature in Tropical Cities
The results for total warming of tropical cities, generally, suggest an increase of approximately 0.20°C per decade for maximum temperatures and 0.24°C for minimum temperatures in cities. The urban warming effect was only identified for minimum temperatures at this scale and resulted in a 0.03°C increase per decade. The seasons in which cities warmed the fastest over the time period was during the fall and winter. The cities that experienced the overall fastest warming were located in monsoonal zones. Those in wet-dry savanna climates did not experience overall urban warming during the study period. Those in rainforests experienced warming in their minimum temperatures.
These results are generally similar to other urban warming findings on a decadal basis. For example, Li et al. (2010) report that urban warming in northeast China was mean 0.04°C per decade. Urban warming effects within the range identified in this study also have been found in North China, where Ren et al. (2008) estimated the largest effect of urbanization on annual mean surface air temperature for the large-cities at 0.16°C per decade and the effect with the smallest effect for small-cities at 0.07°C per decade.
There are also similar findings for urban warming identified in tropical zones. For example, Efe and Eyefia (2014) find that for Benin, a tropical rainforest country in Western Africa, from 1980 to 2012, the country experienced 0.2°C per decade warming. A study of Mexico City, in a sub-tropical climate, finds for annual temperature, the city experienced a 0.16°C increase per decade from 1901 to 1989, but similar trends were not evident for smaller cities (Jauregui, 1992).
Alternatively, a study in East China suggests different results compared to ours with the strongest effect of urban growth on annual mean surface air temperature trends occurring over the metropolises and large cities. For example, this research finds urban warming for metropolitan areas and large cities of approximately 0.398°C and 0.26°C per decade, respectively (Yang et al., 2011). These values are higher than those found in this study.
Factors Affecting Urban Heat in Tropical Cities
The role of population size continues to be explored in urban warming studies. For example, as mentioned above, larger populated cities in China are found to be warmer than smaller population cities (Ren et al., 2008). Generally, UHI research has identified a log-linear relationship between urban population size with urban heat island values (Oke, 1973; Roth, 2007; Santamouris, 2015). We find population size a negligible contributor to urban warming and not as important as either population density or infrastructure. Furthermore, our analysis of temperature and urban form through the use of local climate zones points to the importance of urban design features of cities. This opens up the possibility for natural solutions to urban heat (Biles and Lemberg, 2020).
There is growing consensus that the built environment has a significant impact on temperature (Grimmond, 2007). Infrastructure, population size and density are often identified as important factors in UHI (Sobstyl et al., 2018). For example, Kotharkar and Surawar (2016) identify maximum and minimum air temperatures in core residential and commercial areas as more than 2°C higher than those at the urban fringe. Sun et al. (2020) identify that UHI warming is associated with nighttime light intensity at the intra-urban neighborhood scale for Paris and London. Mallick and Rahman (2012) demonstrate that surface temperatures increase with ward-wise population densities in Delhi, India. These findings provide similar results to this study.
Increased population density and settlement infrastructure can either moderate or elevate urban temperatures (Stone, 2012). Unfortunately, increasing population density often occurs with the loss of vegetative ecosystem services within cities. This loss has an effect on urban temperatures. Several studies have identified the importance of urban design in controlling urban heat (Stone and Rodgers, 2001; Jenerette et al., 2007; Connors et al., 2013; Zhou et al., 2017; Stone et al., 2019). These studies find that increased density is related to urban design as cities develop and specifically the loss of vegetation that ultimately affect UHI and urban temperatures.
Our analyses are not at the resolution to identify changes in greening across cities. However, the LCZ analysis supports the notion that areas of a city with larger amounts or percentages of green tend to be cooler. We further discuss the implications of further urbanization in tropical cities and the possibility of using ecosystem services to address heat in tropical cities.
Use of Ecosystem Services to Address Increasing Heat
The temperature trends in this paper associated with increases in climate change and urban development in tropical countries point to critical policy areas. Given population trends, urban areas in the tropics will grow from medium to large, but more likely to very large or megacities, with millions living in urban areas (Labbé and Sorensen, 2020). For example, Hoornweg and Pope (2016) use the shared socio-economic pathways (SSPs) to generate predictions for urban population size and find that by 2100, the tropical cities of Lagos, Nigeria; Kinshasa, Democratic Republic of Congo; Dar es Salaam, Tanzania; Mumbai and Kolkata, India; and Dhaka, Bangladesh will exceed 50 million. Given current trends identified for urban land use growth (Güneralp et al., 2020), these cities might reach enormous size with much reduced vegetated areas. With continual climate change, urban heat may reach high levels in these locations. Recent projections for Africa suggest that by 2100, even under RCP 2.5 and sustainable development pathways, over 300 million urban Africans will be exposed to very warm (>42°C) for 15 day periods and this number can reach 2 billion under business-as-usual conditions (Marcotullio et al., 2021). Unmitigated warming will result in the potential for increased risk of extreme heat events throughout tropical regions.
Greening is an adaptation approach for addressing temperature increases. Green spaces are known to improve air cooling both in site and its surroundings (Shashua-Bar and Hoffman, 2000) and improve overall thermal comfort in the city (Tong et al., 2017), while street trees also regulate local temperature and provide thermal comfort by transpirative cooling and shading (Bolund and Hunhammar, 1999; Gómez-Baggethun and Barton, 2013; Tan et al., 2020). Shading has increasing impact on cooling and thermal comfort when provided by rows of trees (Manickathan et al., 2018).
Other measures include cool roofs, which are becoming a very popular tool in urban planning, as cities often lack space for other measures. These roofs are a passive cooling technology that improves the albedo effect of the buildings; cool roofs have a coating that reduces solar absorption and increases thermal emittance, thus cooling down the building’s surface (Testa and Krarti, 2017). This method is thus suitable to improve both outdoor and indoor thermal comfort, and it is of especial interest for improving energy efficiency of buildings (Alfaro et al., 2006; Karyono et al., 2017). Similarly, cool walls are also an option being discussed for temperature cooling in tropical cities. However, a study in Singapore (Nazarian et al., 2019) found that, while cool roofs do show some positive results in decreasing the canopy air temperature, cool walls showed only a marginal impact, suggesting that their cooling efficiency is lower than the other methods.
Another approach that can be taken for improving thermal comfort is changing the height of building to the width of street ratio. Studies in this area agree that high H/W leads to better cooling and shading, improving outdoor thermal comfort (Emmanuel et al., 2007; Takkanon, 2017). Dense urban areas with closely spaced buildings, which block or shield wind flow to each other, show higher heat intensity (Sen and Roesler, 2020), and an increase in wind speed in highly dense urban areas could increase thermal comfort for pedestrians at the hottest periods of the day (Jusuf et al., 2017).
The limitations to these measures, as well as their potential ecosystem disservices have barely been investigated, especially in urban areas in the tropics (Haase et al., 2014). Some ecosystem disservices have been acknowledged, and include health problems such as allergies caused by the pollen from plants and trees, or diseases transmitted by animals, along with safety issues such as parks and green spaces being unsafe at night (Gómez-Baggethun and Barton, 2013). Manoli et al. (2019) analyzed summertime differences between rural and urban surface temperatures worldwide to find greening cities might be an ineffective measure to cool temperatures under some climates, and cooling strategies based on both vegetation are more effective in regions where the yearly precipitation is under 1000 mm. Ultimately, they suggest that strategies aimed at increasing green cover and albedo are more efficient in dry regions rather than humid tropical cities. Although based on surface temperatures, unlike most literature focused on urban ecosystem services, this implies that there might be some limitations to the measures traditionally proposed, and that specific measures largely depend on the local climate. Generally, little is known regarding the limitations or ecosystem disservices related to the control of the urban microclimate.
In summary, there is agreement in the literature that shading of any kind is an important measure to counteract the rising of temperatures in urban areas, as it improves both outdoor and indoor thermal comfort (e.g., Karyono et al., 2017). Greening is widely recommended for cooling and shading, but some limitations might arise under specific climates. Cooling roofs and measures based on using the albedo effect might have limitations as well, but it is recommended for cooling off buildings and energy saving.
Similarly, H/W ratios and landscape designs that favor the passing of wind through seem key for cooling off city landscapes, but it might have some limitations as already built up cities are difficult to redesign.
Implications of the Findings for the Future of Tropical Cities
The results of this study identify increases in maximum and minimum temperatures in tropical cities around over the past 6 decades. The total warming in urban areas has been significant (∼1°C). There are differences in warming between cities of different tropical zones. Generally, we find that many tropical cities have warmed over time. That is, the UHI effect has increased in rainforest and monsoonal cities over time. Monsoonal cities have experienced the highest levels of urban warming over the study period. While tropical wet-dry savanna climate cities experience the highest mean maximum temperatures, they have experienced the smallest changes in mean temperatures compared to cities in other tropical zones. In fact, tropical wet-dry savanna cities have experienced no urban warming over the study period.
The increase in warming of cities further exacerbates the impact of heat waves. This is particularly important for tropical countries and cities. Climate impacts include an increase in the number of exceptionally hot days. Research has identified high heatwave occurrence and large numbers of exposed populations, particularly in cities (Dosio et al., 2018; Rohat et al., 2020; Mishra et al., 2015; Marcotullio et al., 2021). Climate impacts in tropical zones may have a significantly negative effect on economic growth (IPCC, 2019). Other research has found that 20% of the global land area, centered in low-latitude regions, is projected to experience highly unusual monthly temperatures during Northern Hemisphere summers at 1.5°C of global warming, with this percent nearly doubling at 2°C of global warming (Coumou and Robinson, 2013).
Policymakers, engineers, and urban planners will need to assess how to address the increasing heat in tropical cities. Options include increasing electrification and provisioning of air-conditioned housing, which under renewable sourced power generation, would not contribute further to climate change. The trade-offs faced by nations and cities powering their electric grids with non-renewable fuels is stark.
Our research only points to the importance of including ecosystem services in urban design through the analysis of temperatures across LCZs. This supports other research on the importance of natural ecosystem-based solutions in urban design for controlling heat. Ecosystem service solutions have often been overlooked. Urban and regional decision-makers should seriously consider the use of ecosystem and green infrastructure options. The types of ecosystem services, however, must be chosen with care. One observer suggests that these solutions must be “tropicalized” to fit local conditions (Macías et al., 2018). By reducing temperatures in urban areas through these interventions, however, there is the potential for health co-benefits including reducing the potential impact of extreme heat events (Heaviside et al., 2017).
Limitations of the Study
There are several important qualifications to this analysis including sources of uncertainty. First, a compilation of different datasets across several climate sub-zones provides an interesting perspective but introduces several sources uncertainty in the results. Our analysis provides for a general comparison of trends among cities in the tropics but can only supplement more detailed case studies of individual cities. Second, we count on the accuracy of a limited number of weather stations for our temperature data. While we use several decades of data, this does not make up for the fact that some stations may not provide consistent values. There is also uncertainty in the indicator datasets. While the data used may be the best available they include their own uncertainty related to the models by which they were generated. Finally, while we believe that nature-based solutions have been overlooked and have the potential to effectively address heat, we have not quantified their effects. Rather we used a general overview of the literature and secondary data provided by past studies in our arguments. Further detailed studies of cities in different tropical zones are necessary to identify the level of effectiveness of ecosystem services for reducing heat.
Conclusion
This project attempted to quantify the growing heat in tropical cities, the differences in these trends among tropical zones and an evaluation of the factors associated with the increasing of heat. The findings suggest that the mean urban temperatures by day, season and year have grown faster than the background temperatures in some tropical zones. While all cities across the tropics have experienced warmer conditions, those in rainforest and monsoonal zones have experienced increased urban warming (i.e., increasing intensity of UHI).
Growing populations, increasing population densities and higher radiance from nighttime lights are all associated with changes in temperature, but population density and infrastructure (identified through nighttime lights radiance) seem to be the better predictors than population size. Moreover, urban land use is an important factor. The land use results suggest that urban design including natural ecosystem-based solutions could be an important factor in moderating heat. Compacting cities increases heat without proper vegetative influences. Using vegetation with urban design can counter this trend. A focus on urban infrastructure, including “cool roofs,” increasing vegetation and urban water features could potentially reduce ambient temperatures in urban areas. At the same time, more knowledge for the appropriate forms of ecosystem services in tropical cities is necessary. These findings are fundamental to urban plans and could be used to help in designing cities for the coming heat with climate change.
Data Availability Statement
The original contributions presented in the study are included in the article/Supplementary Material, further inquiries can be directed to the corresponding author.
Author Contributions
PJM, CK and RQG developed concept, PJM and CK performed analyses, PJM, CK, RQG and MS researched and wrote the paper. All authors had approved the final manuscript for submission.
Funding
This research has been partially funded by the European Union’s Horizon 2020 research and innovation programme under Grant ID 870649 and the Asia Pacific Network for Global Change Research (APN) under Grant ID CRRP2017-01MY-Marcotullio.
Conflict of Interest
The authors declare that the research was conducted in the absence of any commercial or financial relationships that could be construed as a potential conflict of interest.
Publisher’s Note
All claims expressed in this article are solely those of the authors and do not necessarily represent those of their affiliated organizations, or those of the publisher, the editors and the reviewers. Any product that may be evaluated in this article, or claim that may be made by its manufacturer, is not guaranteed or endorsed by the publisher.
Supplementary Material
The Supplementary Material for this article can be found online at: https://www.frontiersin.org/articles/10.3389/fevo.2021.616626/full#supplementary-material
Footnotes
- ^ See https://globalforestatlas.yale.edu/tropical-zone
- ^ www.worldclim.org
- ^ naturalearthdata.com
- ^ See United States Department of Agriculture definitions for rural population densities at https://www.ers.usda.gov/topics/rural-economy-population/rural-classifications/what-is-rural/
References
Alexander, L. V., Zhang, X., Peterson, T. C., Caesar, J., Gleason, B., Klein Tank, A. M. G., et al. (2006). Global observed changes in daily climate extremes of temperature and precipitation. J. Geophys. Res. Atmos. 111:D05109.
Alfaro, E. J., Gershunov, A., and Cayan, D. (2006). Prediction of summer maximum and minimum temperature over the Central and Western United States: the roles of soil moisture and sea surface temperature. J. Clim. 19, 1407–1421. doi: 10.1175/jcli3665.1
Arnfield, A. J. (2003). Two decades of urban climate research: a review of turbulence, exchanges of energy and water, and the urban heat island. Int. J. Climatol. 23, 1–26. doi: 10.1002/joc.859
Bechtel, B., Demuzere, M., Mills, G., Zhan, W., Sismanidis, P., Small, C., et al. (2019). SUHI analysis using Local Climate Zones—A comparison of 50 cities. Urban Clim. 28:100451. doi: 10.1016/j.uclim.2019.01.005
Beck, H. E., Zimmermann, N. E., McVicar, T. R., Vergopolan, N., Berg, A., and Wood, E. F. (2018). Present and future Köppen-Geiger climate classification maps at 1-km resolution. Sci. Data 5:180214.
Biles, J. J., and Lemberg, D. S. (2020). A multi-scale analysis of urban warming in residential areas of a latin american city: the case of Mérida, Mexico. J. Plann. Educ. Res. doi: 10.1177/0739456X209230020 [Epub ahead of print].
Buyantuyev, A., Xu, P., Wu, J., Piao, S., and Wang, D. (2012). A space-for-time (SFT) substitution approach to studying historical phenological changes in Urban Environment. PLoS One 7:e51260. doi: 10.1371/journal.pone.0051260
Ceccherini, G., Russo, S., Ameztoy, I., Marchese, A. F., and Carmona-Moreno, C. (2017). Heat waves in Africa 1981–2015, observations and reanalysis. Hazards Earth Syst. Sci. 17, 115–127. doi: 10.5194/nhess-17-115-2017
Changnon, S. A. (1992). Inadvertent weather modification in urban areas: lessons for global climate change. Bull. Am. Meteorol. Soc. 73, 619–627. doi: 10.1175/1520-0477(1992)073<0619:iwmiua>2.0.co;2
Christidis, N., Jones, G. S., and Stott, P. A. (2015). Dramatically increasing chance of extremely hot summers since the 2003 European heatwave. Nat. Clim. Change 5, 46–50. doi: 10.1038/nclimate2468
Connors, J. P., Galletti, C. S., and Chow, W. T. L. (2013). Landscape configuration and urban heat island effects: assessing the relationship between landscape characteristics and land surface temperature in Phoenix, Arizona. Landsc. Ecol. 28, 271–283. doi: 10.1007/s10980-012-9833-1
Corbane, C., Florczyk, A., Pesaresi, M., Politis, P., and Syrris, V. (2018). GHS Built-Up Grid, Derived from Landsat, Multitemporal (1975-1990-2000-2014). Ispra: European Commission, Joint Research Centre (JRC).
Coumou, D., and Robinson, A. (2013). Historic and future increase in the global land area affected by monthly heat extremes. Environ. Res. Lett. 8:034018. doi: 10.1088/1748-9326/8/3/034018
Damgaard, C. (2019). A critique of the space-for-time substitution practice in community ecology. Trends Ecol. Evol. 34, 416–421. doi: 10.1016/j.tree.2019.01.013
Debbage, N., and Shepherd, J. M. (2015). The urban heat island effect and city contiguity. Computers. Environ. Urban Syst. 54, 181–194. doi: 10.1016/j.compenvurbsys.2015.08.002
Della-Marta, P. M., Haylock, M. R., Luterbacher, J., and Wanner, H. (2007). Doubled length of western European summer heat waves since 1880. J. Geophys. Res. Atmos. 112:8510.
Dodson, R., and Marks, D. (1997). Daily air temperature interpolated at high spatial resolution over a large mountainous region. Clim. Res. 8, 1–20. doi: 10.3354/cr008001
Dosio, A., Mentaschi, L., Fischer, E. M., and Wyser, K. (2018). Extreme heat waves under 1.5 °C and 2 °C global warming. Environ. Res. Lett. 13:054006. doi: 10.1088/1748-9326/aab827
Efe, S. I., and Eyefia, O. A. (2014). Urban warming in Benin City, Nigeria. Atmos. Cilm. Sci. 4, 241–252. doi: 10.4236/acs.2014.42027
Emmanuel, R., Roselund, H., and Johansson, E. (2007). Urban shading – a design option for the tropics? A study in Colombo, Sri Lanka. Int. J. Climatol. 27, 1995–2004. doi: 10.1002/joc.1609
Erell, E., and Williamson, T. (2007). Intra-urban differences in canopy layer air temperatures at a mid-latitude city. Int. J. Climatol. 27, 1243–1255. doi: 10.1002/joc.1469
Freire, S., MacManus, K., Pesaresi, M., Doxsey-Whitfield, E., and Mills, J. (2016). “Development of new open and free multi-temporal global population grids at 250 m resolution,” in Geospatial Data in a Changing World, eds T. Sarjakoski, M. Y. Santos, and L. T. Sarjakoski (Berlin: Springer).
Galagoda, R. U., Jayasinghe, G. Y., Halwatura, R. U., and Rupasinghe, H. T. (2018). The impact of urban green infrastructure as a sustainable approach towards tropical micro-climatic changes and human thermal comfort. Urban For. Urban Green. 34, 1–9. doi: 10.1016/j.ufug.2018.05.008
Geletiča, J., Lehnert, M., Savić, S., and Milošević, D. (2019). Inter-/intra-zonal seasonal variability of the surface urban heat island based on local climate zones in three central European cities. Build. Environ. 156, 21–32. doi: 10.1016/j.buildenv.2019.04.011
Gómez-Baggethun, E., and Barton, D. N. (2013). Classifying and valuing ecosystem services for urban planning. Ecol. Econ. 86, 235–245. doi: 10.1016/j.ecolecon.2012.08.019
Grimmond, S. (2007). Urbanization and global environmental change: local effects of urban warming. Geogr. J. 173, 83–88. doi: 10.1111/j.1475-4959.2007.232_3.x
Güneralp, B., Reba, M., Hales, B. U., Wentz, E. A., and Seto, K. C. (2020). Trends in urban land expansion, density, and land transitions from 1970 to 2010: a global synthesis. Environ. Res. Lett. 15:044015. doi: 10.1088/1748-9326/ab6669
Haase, D., Larondelle, N., Andersson, E., Artmann, M., Borgström, S., Breuste, J., et al. (2014). A quantitative review of urban ecosystem service assessments: concepts, models, and implementation. Ambio 43, 413–433. doi: 10.1007/s13280-13014-10504-13280
Habel, J. C., Rasche, L., Schneider, U. A., Engler, J. O., Schmid, E., Rödder, D., et al. (2019). Final countdown for biodiversity hotspots. Conserv. Lett. 12:e12668.
Hamstead, Z. A., Kremer, P., Larondelle, N., McPhearson, T., and Haase, D. (2016). Classification of the heterogeneous structure of urban landscapes (STURLA) as an indicator of landscape function applied to surface temperature in New York City. Ecol. Indic. 70, 574–585. doi: 10.1016/j.ecolind.2015.10.014
Hansen, M., Potapov, P. V., Moore, R., Hancher, M., Turubanova, S. A., Tyukavina, A., et al. (2013). High-resolution global maps of 21st-century forest cover change. Science 342, 850–853. doi: 10.1126/science.1244693
Harlan, S. L., and Ruddell, D. M. (2011). Climate change and health in cities: impacts of heat and air pollution and potential co-benefits from mitigation and adaptation. Curr. Opin. Environ. Sustainab. 3, 126–134. doi: 10.1016/j.cosust.2011.01.001
Harrington, L. J., Frame, D. J., Fischer, E. M., Hawkins, E., Joshi, M., and Jones, C. D. (2016). Poorest countries experience earlier anthropogenic emergence of daily temperature extremes. Environ. Res. Lett. 11:055007. doi: 10.1088/1748-9326/1011/1085/055007
Heaviside, C., Macintyre, H., and Vardoulakis, S. (2017). The urban heat island: implications for health in a changing environment. Curr. Environ. Health Rep. 4, 296–305. doi: 10.1007/s40572-017-0150-3
Hijmans, R. J., Cameron, S. E., Parra, J. L., Jones, P. G., and Jarvis, A. (2005). Very high resolution interpolated climate surfaces for global land areas. Int. J. Climatol. 25, 1965–1978. doi: 10.1002/joc.1276
Hinkel, K. M., Nelson, F. E., Klene, A. E., and Bell, J. H. (2003). The urban heat island in winter at Barrow, Alaska. Int. J. Climatol. 23, 1889–1905. doi: 10.1002/joc.971
Hoornweg, D., and Pope, K. (2016). Population predictions for the world’s largest cities in the 21st century. Urban. Environ. 29, 195–216. doi: 10.1177/0956247816663557
Horton, R. M., Mankin, J. S., Lesk, C., Coffel, E., and Raymond, C. (2016). A review of recent advances in research on extreme heat events. Curr. Clim. Change Rep. 2, 242–259. doi: 10.1007/s40641-016-0042-x
Howard, L. (1818). The Climate of London, Deduced from Meteorological Observations Made at Different Places In the Neighborhood of the Metropolis, in Two Volumes. London: W. Phillips, George Yard.
Huang, K., Li, X., Liu, X., and Seto, K. C. (2019). Projecting global urban land expansion and heat island intensification through 2050. Environ. Res. Lett. 14:114037. doi: 10.1088/1748-9326/ab4b71
IPCC (2014a). “Climate change 2014: impacts, adaptation, and vulnerability. part b: regional aspects,” in Contribution of Working Group II to the Fifth Assessment Report of the Intergovernmental Panel on Climate Change, eds V. R. Barros, C. B. Field, D. J. Dokken, M. D. Mastrandrea, K. J. Mach, T. E. Bilir, et al. (Cambridge, MA: Cambridge University Press).
IPCC (2014b). Synthesis Report. Contribution of Working Groups I, II and III to the Fifth Assessment Report of the Intergovernmental Panel on Climate Change. Geneva: IPCC.
IPCC (2019). ““Global Warming of 1.5°C. An IPCC Special Report on the impacts of global warming of 1.5°C above pre-industrial levels and related global greenhouse gas emission pathways,” in the context of strengthening the global response to the threat of climate change, sustainable development, and efforts to eradicate poverty,”, eds V. Masson-Delmotte, P. Zhai, H.-O. Pörtner, D. Roberts, J. Skea, P. R. Shukla, et al. (Cambridge: Cambridge University Press).
Jauregui, E. (1992). Aspects of monitoring local/regional climate chaneg in a tropical region. Atmosfer 5, 69–78.
Jenerette, G. D., Harlan, S. L., Brazel, A., Jones, N., Larsen, L., and Stefanov, W. L. (2007). Regional Relationships between surface temperature, vegetation, and human settlement in a rapidly urbanizing ecosystem. Landsc. Ecol. 22, 353–365. doi: 10.1007/s10980-006-9032-z
Jiang, L., and O’Neill, B. C. (2017). Global urbanization projections for the shared socioeconomic pathways. Glob. Environ. Change 42, 193–199. doi: 10.1016/j.gloenvcha.2015.03.008
Jones, P. D., Groisman, P. Y., Coughlan, M., Plummer, N., Wang, W.-C., and Karl, T. R. (1990). Assessment of urbanization effects in time series of surface air temperature over land. Nat. Clim. Change 347, 169–172. doi: 10.1038/347169a0
Jusuf, S. K., Ignatius, M., Wong, N. H., and Tan, E. (2017). “STEVE tool plug-in for SketchUp: a user friendly microclimatic mapping tool for estate development,” in Sustainable Building and Built Environments to Mitigate Climate Change in the Tropics, eds T. H. Karyono, R. Vale, and B. Vale (Switzerland: Springer International Publishing), 249–260.
Karyono, T. H., Vale, R., and Vale, B. (2017). Sustainable Building and Built Environments to Mitigate Climate Change in the Tropics. Switzerland: Springer Intenrational Publishing.
Kataoka, K., Matsumoto, F., Ichinose, T., and Taniguchi, M. (2009). Urban warming trends in several large Asian cities over the last 100 years. Sci. Tot. Environ. 407, 3112–3119. doi: 10.1016/j.scitotenv.2008.09.015
Kotharkar, R., and Surawar, M. (2016). Land use, land cover, and population density impact on the formation of canopy urban heat islands through traverse survey in the Nagpur Urban Area, India. J. Urban Plann. Dev. 142:04015003. doi: 10.1061/(asce)up.1943-5444.0000277
Kriticos, D. J., Webber, B. L., Leriche, A., Ota, N., Macadam, I., Bathols, J., and Scott, J. K. (2012). CliMond: global high resolution historical and future scenario climate surfaces for bioclimatic modelling. Methods. Ecol. Evol. 3, 53–64, doi: 10.1111/j.2041-1210X.2011.00134.x
Labbé, D., and Sorensen, A. (eds) (2020). Handbook of Megacities and Megacity-Regions. London: Edward Elgar.
Lambin, E. F., Geist, H. J., and Lepers, E. (2003). Dynamics of land-use and land-cover change in tropical regions. Annu. Rev. Environ. Resour. 28, 205–241.
Li, Q., Li, W., Si, P., Xiaorong, G., Dong, W., Jones, P., et al. (2010). Assessment of surface air warming in northeast China, with emphasis on the impacts of urbanization. Theor. Appl. Climatol. 99, 469–478. doi: 10.1007/s00704-009-0155-4
Macías, V. B., Ramírez, J. N. S., Delgado, Y. M., Córdoba, M., and Rubio, A. O. (2018). 84 years of Mexico’s land use planning: reflections for biodiversity conservation. Nova Sci. 10, 592–629. doi: 10.21640/ns.v10i20.1177
Makrogiannis, T., Santamouris, M., Papanikolaou, N., Koronaki, I., Tselepidaki, I., and Assimakopoulos, D. (1998). The Athens urban climate experience - Temperature distribution. Acta Univ. Lodziensis Folis Geogr. Phys. 3, 33–44.
Mallick, J., and Rahman, A. (2012). Impact of population density on the surface temperature and micro-climate of Delhi. Curr. Clim. 102, 1708–1713.
Manickathan, L., Defraeye, T., Allegrini, J., Derome, D., and Carmeliet, J. (2018). Parametric study of the influence of environmental factors and tree properties on the transpirative cooling effects of trees. Agric. For. Meteorol. 248, 259–274. doi: 10.1016/j.agrformet.2017.10.014
Manoli, G., Fatichi, S., Schläpfer, M., Yu, K., Crowther, T. W., Meili, N., et al. (2019). Magnitude of urban heat islands largely explained by climate and population. Nature 573, 55–60. doi: 10.1038/s41586-019-1512-9
Marcotullio, P. J., Kessler, C., and Fekete, B. (2021). The future urban heat-wave challenge in Africa: exploratory analysis. Glob. Environ. Change 66:102190. doi: 10.1016/j.gloenvcha.2020.102190
Matthews, T. K. R., Wilby, R. L., and Murphy, C. (2017). Communicating the deadly consequences of global warming for human heat stress. Proc. Natl. Acad. Sci. U.S.A. 114, 3861–3866. doi: 10.1073/pnas.1617526114
McGranahan, G., Marcotullio, P. J., Bai, X., Balk, D., Braga, T., Douglas, I., et al. (2005). “Urban systems,” in Millennium Ecosystem Assessment, Current State and Trends: Findings of the Condition and Trends Working Group. Ecosystems and Human Well-Being, eds R. Hassan, R. Scholes, and N. Ash (Washington DC: Island Press), 795–825.
Menne, M. J., Durre, I., Korzeniewski, B., McNeal, S., Thomas, K., Yin, X., et al. (2012a). Global Historical Climatology Network - Daily (GHCN-Daily), Version 3. [Version 3.12]. Washington, DC: NOAA National Climatic Data Center.
Menne, M. J., Durre, I., Vose, R. S., Gleason, B. E., and Houston, T. G. (2012b). An overview of the global historical climatology network-daily database. J. Atmos. Ocean. Technol. 29, 897–910. doi: 10.1175/jtech-d-11-00103.1
Mishra, V., Ganguly, A. R., Nijssen, B., and Lettenmaier, D. P. (2015). Changes in observed climate extremes in global urban areas. Environ. Res. Lett. 10:024005. doi: 10.1088/1748-9326/1010/1082/024005
Mora, C., Dousset, B., Caldwell, I. R., Powell, F. E., Geronimo, R. C., Bielecki, C. R., et al. (2017). Global risk of deadly heat. Nat. Clim. Change 7, 501–506.
Nazarian, N., Dumas, N., Kleissl, J., and Norford, L. (2019). Effectiveness of cool walls on cooling load and urban temperature in a tropical climate. Energy Build. 187, 144–162. doi: 10.1016/j.enbuild.2019.01.022
Nikulin, G., Lennard, C., Dosio, A., Kjellstrom, E., Chen, Y., Hansler, A., et al. (2018). The effects of 1.5 and 2 degrees of global warming on Africa in the CORDEX ensemble. Environ. Res. Lett. 13:065003. doi: 10.1088/1748-9326/aab1b1
Nissan, H., Burkart, K., Coughlan de Perez, E., Van Aalst, M., and Mason, S. (2017). Defining and predicting heat waves in Bangladesh. J. Appl. Meteorol. Climatol. 56, 2653–2670. doi: 10.1175/jamc-d-17-0035.1
Oke, T. R. (1973). City size and the urban heat island. Atmos. Environ. 7, 769–779. doi: 10.1016/0004-6981(73)90140-6
Oke, T. R., Mills, G., Christen, A., and Voogt, J. A. (2017). Urban Climates. Cambridge, MA: Cambridge University Press.
Perkins, S. E. (2015). A review on the scientific understanding of heatwaves—Their measurement, driving mechanisms, and changes at the global scale. Atmos. Res. 164, 242–267. doi: 10.1016/j.atmosres.2015.05.014
Perkins, S. E., Alexander, L. V., and Nairn, J. R. (2012). Increasing frequency, intensity and duration of observed global heatwaves and warm spells. Geophys. Res. Lett. 39:20714. doi: 10.1029/2012GL053361
Pigeon, G., Legain, D., Durand, P., and Masson, V. (2007). Anthropogenic heat release in an old European agglomeration (Toulouse, France). Int. J. Climatol. 27, 1969–1981. doi: 10.1002/joc.1530
Primack, R. B., and Morrison, R. A. (2013). “Causes of extinction,” in Encyclopedia of Biodiversity, 2nd Edn, ed. S. A. Levin (Cambridge, MA: Academic Press), 401–412.
Rahmstorf, S., and Coumou, D. (2011). Increase of extreme events in a warming world. Proc. Natl. Acad. Sci. U.S.A. 108, 17905–17909. doi: 10.1073/pnas.1101766108
Ramiìrez-Aguilar, E. A., and Souza, L. A. C. L. (2019). Urban form and population density: influences on Urban Heat Island intensities in Bogotaá, Colombia. Urban Clim. 29:100497. doi: 10.1016/j.uclim.2019.100497
Ren, G., Zhou, Y., Shu, Z., Zhou, J., Zhang, A., Guo, J., et al. (2008). Urbanization effects on observed surface air temperature trends in North China. J. Clim. 21, 1333–1348. doi: 10.1175/2007jcli1348.1
Rizwan, A. M., Leung, D. Y. C., and Liu, C. (2008). A review on the generation, determination and mitigation of Urban Heat Island. J. Environ. Sci. 20, 120–128. doi: 10.1016/s1001-0742(08)60019-4
Rohat, G., Flacke, J., Dosio, A., Dao, H., and van Maarseveen, M. (2020). Projections of human exposure to dangerous heat in african cities under multiple socioeconomic and climate scenarios. Earth’s Future 7, 528–546. doi: 10.1029/2018ef001020
Rosenthal, J. K., Kinney, P., and Metzger, K. B. (2014). Intra-urban vulnerability to heat-related mortality in New York City, 1997–2006. Health Place 30, 45–60. doi: 10.1016/j.healthplace.2014.07.014
Roth, M. (2007). Review of urban climate research in (sub)tropical regions. Int. J. Climatol. 27, 1859–1873. doi: 10.1002/joc.1591
Russo, S., Dosio, A., Graversen, R. G., Sillmann, J., Carrao, H., Dunbar, M. B., et al. (2014). Magnitude of extreme heat waves in present climate and their projection in a warming world. J. Geophys. Res. Atmos. 119, 12500–12512.
Russo, S., Sillmann, J., Sippel, S., Barcikowska, M. J., Ghisetti, C., Smid, M., et al. (2019). Half a degree and rapid socioeconomic development matter for heatwave risk. Nat. Commun. 10:136. doi: 10.1038/s41467-018-08070-4
Salvati, A., Roura, H. C., and Cecere, C. (2017). Assessing the urban heat island and its energy impact on residentialbuildings in Mediterranean climate: Barcelona case study. Energy Build. 146, 38–54. doi: 10.1016/j.enbuild.2017.04.025
Santamouris, M. (2015). Analyzing the heat island magnitude and characteristics in one hundred Asian and Australian cities and regions. Sci. Total Environ. 512-513, 582–598. doi: 10.1016/j.scitotenv.2015.01.060
Santamouris, M., Paolini, R., Haddad, S., Synnefa, A., Garshasbi, S., Hatvani-Kovacs, G., et al. (2020). Heat mitigation technologies can improve sustainability in cities. An holistic experimental and numerical impact assessment of urban overheating and related heat mitigation strategies on energy consumption, indoor comfort, vulnerability and heat-related mortality and morbidity in cities. Energy Build. 217:110002. doi: 10.1016/j.enbuild.2020.110002
Schiavina, M., Freire, S., and MacManus, K. (2019). “GHS population grid multitemporal (1975, 1990, 2000, 2015)”. R2019A. Ispra: European Commission, Joint Research Centre (JRC).
Sen, S., and Roesler, J. (2020). Wind direction and cool surface strategies on microscale urban heat island. Urban Clim. 31:100548. doi: 10.1016/j.uclim.2019.100548
Shashua-Bar, L., and Hoffman, M. (2000). Vegetation as a climatic component in the design of an urban street: an empirical model for predicting the cooling effect of urban green areas with trees. Energy Build. 31, 221–235. doi: 10.1016/s0378-7788(99)00018-3
Sobstyl, J., Emig, T., Qomi, M. J. A., Ulm, F. J., and Pellenq, R. (2018). Role of city texture in Urban Heat Islands at Nighttime. Phys. Rev. Lett. 120:108701.
Stewart, I. D., and Oke, T. R. (2012). Local climate zones’ for urban temperature studies. Bull. Am. Meteorol. Soc. 93, 1879–1900. doi: 10.1175/bams-d-11-00019.1
Stone, B. (2012). The City and the Coming Climate: Climate Change in the Places We Live. New York, NY: Cambridge University Press.
Stone, B., Lanza, K., Mallen, E., Vargo, J., and Russell, A. (2019). Urban heat management in louisville, kentucky: a framework for climate adaptation planning. J. Plann. Educ. Res. doi: 10.1177/0739456X19879214 [Epub ahead of print].
Stone, B., and Rodgers, M. O. (2001). Urban form and thermal efficiency: how the design of cities influences the urban heat island effect. J. Am. Plann. Assoc. 67, 186–198. doi: 10.1080/01944360108976228
Sun, Y., Wang, S., and Wang, Y. (2020). Estimating local-scale urban heat island intensity using nighttime light satellite imageries. Sustain. Cities Soc. 57:102125. doi: 10.1016/j.scs.2020.102125
Sun, Y., Zhang, X., Ren, G., Zwiers, F. W., and Hu, T. (2016). Contribution of urbanization to warming in China. Nat. Clim. Change 6, 706–710. doi: 10.1038/nclimate2956
Sun, Y., Zhang, X., Zwiers, F. W., Song, L., Wan, H., Hu, T., et al. (2014). Rapid increase in the risk to extreme summer heat in Eastern China. Nat. Clim. Change 4, 1082–1085. doi: 10.1038/nclimate2410
Takkanon, P. (2017). UHI and thermal performance of office buildings in Bangkok. Proc. Eng. 180, 241–251. doi: 10.1016/j.proeng.2017.04.183
Tan, P. Y., Wong, N. H., Tan, C. L., Jusuf, S. K., Schmiele, K., and Chiam, Z. Q. (2020). Transpiration and cooling potential of tropical urban trees from different native habitats. Sci. Total Environ. 705:135764. doi: 10.1016/j.scitotenv.2019.135764
Testa, J., and Krarti, M. (2017). A review of benefits and limitations of static and switchable cool roof systems. Renew. Sustain. Energy Rev. 77, 451–460. doi: 10.1016/j.rser.2017.04.030
Tolle, M. H., Engler, S., and Panitz, H.-J. (2017). Impact of abrupt land cover changes by tropical deforestation on southeast asian climate and agriculture. J. Clim. 30, 2587–2600. doi: 10.1175/jcli-d-16-0131.1
Tong, S., Wong, N. H., Tan, C. L., Jusuf, S. K., Ignatius, M., and Tan, E. (2017). Impact of urban morphology on microclimate and thermal comfort in China. Solar Energy 155, 212–223. doi: 10.1016/j.solener.2017.06.027
UN (2017). World Population Prospects, 2017 Revisions. New York, NY: UN Department of Economic and Social Affairs.
UN (2018). World Urbanization Prospects, 2018 Revisions. New York, NY: United Nations Department of Economic and Social Affairs.
Venter, Z. S., Krog, N. H., and Barton, D. N. (2020). Linking green infrastructure to urban heat and human health risk mitigation in Oslo, Norway. Sci. Total Environ. 709, 136–193.
Voogt, J. (2002). “Urban heat island,” in Encyclopedia of global environmental change, Volume III Causes and Consequences of Global Environmental Change, eds I. Douglas and T. Munn (Chichester: John Wiley & Sons, Ltd), 660–666.
Wang, J., and Yan, Z.-W. (2016). Urbanization-related warming in local temperature records: a review. Atmos. Ocean. Sci. Lett. 9, 129–138. doi: 10.1080/16742834.2016.1141658
Wang, Y., and Hu, F. (2006). Variations of the urban heat island in summer of the recent 10 years over Beijing and its environment effects. Chinese J. Geophys. 49, 59–67. doi: 10.1002/cjg2.812
World Bank (2018). The Number of Extremely Poor People Continues to Rise in Sub-Saharan Africa. Washington, DC: The World Bank.
Yang, X., Hou, Y., and Chen, B. (2011). Observed surface warming induced by urbanization in east China. J. Geophys. Res. 116:D14113.
Keywords: urbanization, urban warming, urban density, tropics, ecosystem services
Citation: Marcotullio PJ, Keßler C, Quintero Gonzalez R and Schmeltz M (2021) Urban Growth and Heat in Tropical Climates. Front. Ecol. Evol. 9:616626. doi: 10.3389/fevo.2021.616626
Received: 12 October 2020; Accepted: 16 July 2021;
Published: 13 August 2021.
Edited by:
Jose Antonio Puppim De Oliveira, Escola de Administração da Fundação Getulio Vargas (FGV-EAESP), BrazilReviewed by:
Mahua Mukherjee, Indian Institute of Technology Roorkee, IndiaTatiana Maria Gadda, Federal Technological University of Paraná, Brazil
Copyright © 2021 Marcotullio, Keßler, Quintero Gonzalez and Schmeltz. This is an open-access article distributed under the terms of the Creative Commons Attribution License (CC BY). The use, distribution or reproduction in other forums is permitted, provided the original author(s) and the copyright owner(s) are credited and that the original publication in this journal is cited, in accordance with accepted academic practice. No use, distribution or reproduction is permitted which does not comply with these terms.
*Correspondence: Peter J. Marcotullio, peter.marcotullio@hunter.cuny.edu