Article

Beta Diversity of Plant Communities in Relation to Soil C:N:P Stoichiometry across 150 Years of Vegetation Restoration in a Temperate Zone

1
The Research Center of Soil and Water Conservation and Ecological Environment, Chinese Academy of Sciences and Ministry of Education, Xianyang 712100, China
2
Institute of Soil and Water Conservation, Chinese Academy of Sciences and Ministry of Water Resources, Xianyang 712100, China
3
University of Chinese Academy of Sciences, Beijing 100049, China
4
Institute of Soil and Water Conservation, Northwest A&F University, Xianyang 712100, China
5
College of Urban, Rural Planning and Architectural Engineering, Shangluo University, Shangluo 726000, China
*
Author to whom correspondence should be addressed.
Forests 2023, 14(3), 553; https://doi.org/10.3390/f14030553
Submission received: 4 February 2023 / Revised: 28 February 2023 / Accepted: 8 March 2023 / Published: 10 March 2023
(This article belongs to the Special Issue Forest Restoration and Secondary Succession—Series II)

Abstract

:
Natural solutions by which humans can overcome challenges have been severely hampered by biodiversity losses. It is essential to understand the key natural variables that influence changes in community diversity to maintain ecosystem function. The Ziwuling area has a natural recovery succession history of 150 years. Therefore, a survey was conducted to compare species composition characteristics across different vegetation recovery stages while also providing a phylogenetic and taxonomic response to the correlation between beta diversity and soil stoichiometry. The results showed that beta diversity and endemic plants had a similar single-peak temporal pattern. Soil organic carbon (SOC) accumulation was significantly positively correlated with total nitrogen (TN) and was also negatively correlated with total phosphorus (TP). Overall, soil TN, time since vegetation restoration (TVR in years), and W-SS (endemic woody plants at each stage) were able to explain 94.3% of the total variation in beta diversity. Temperate species such as Carex lanceolata, Lespedeza bicolor, and Sophora davidii are the basis for community construction. Community beta diversity patterns are the result of a mixture of ecological (e.g., climate patterns and soil nutrients) and evolutionary processes. This study combined plant resource needs with how they respond to natural recovery times in order to provide useful knowledge to protect biodiversity, the nutrient cycle, and the function of restoration ecology.

1. Introduction

With the help of the Kunming–Montreal Global Biodiversity Framework, humans are making a peace treaty with the natural world in the hopes of stopping the rapid deterioration of biodiversity around the world [1]. Biodiversity plays a crucial role in maintaining the prosperity of Earth’s ecosystems and human societies [2,3]. Furthermore, biodiversity may have widespread effects on ecological processes and functions, in terms of both space and time [4,5]. Understanding the causes and patterns of changes in biodiversity has been at the center of recent ecological studies, considering its growing importance as a reflection of the complexity of natural ecosystems [6]. If we understand these processes, we will be better equipped to protect species and ensure a healthy ecology [7].
Beta (β) diversity is a key aspect of biodiversity, since it reflects variations in species composition across communities and at various geographical and temporal scales, while mediating the relationship between alpha (α) and gamma (γ) diversity [8,9]. The dynamics of biodiversity patterns are more accurately captured by describing β-diversity, as opposed to α-diversity, at the local scale [10]. The mechanism of biodiversity maintenance can be revealed through the study of β-diversity, which therefore provides a foundation for our understanding of not only interactions between species and their environment, but also the function of numerous ecological processes in community development [11,12]. Ecological niche theory and neutral theory have dominated the discussion on the mechanics of β-diversity generation over the past two decades [13,14,15]. Ecological niche theory emphasizes the involvement of deterministic processes, such as habitat filtering and competitive exclusion, in the formation of communities, on the premise that ecological niche differentiation is necessary for species coexistence [16,17]. Neutral theory downplays the significance of environmental selection in favor of random processes, such as dispersion limitation and ecological drift, in shaping the composition of communities [18,19]. Mounting evidence has indicated that ecological niche theory and neutral theory are not mutually exclusive, but rather, that the ecological mechanisms underlying their development may vary in relative importance across sampling scales [20,21,22,23]. However, the key points of these analyses are the constraints imposed by environmental filtering and disparities in geographic distribution across spatial distances [24,25,26,27,28]. Regarding time variation, there is a lack of written information on the relationship between β-diversity and environmental variables.
Meanwhile, to deal with climate change, the world has been putting more effort into restoring forests to provide better ecological services and biodiversity benefits [29]. However, scientists have had difficulties agreeing on a common afforestation strategy [30]. This is due to the fact that environmental variables, in addition to spatial heterogeneity, may play a shifting role in determining species composition over time [31,32]. Community formation may also be affected by shifts in interspecific interactions and propagule dissemination over time [33,34,35,36]. This further emphasizes the need to understand the primary environmental variables that steer the patterns of community assembly and diversity shifts. The process and nature of community succession are embodied in the interactions between vegetation and soil [37]. In natural ecosystems, soil C:N:P stoichiometry is a major limiting nutrient factor linked to many different types of plant change, while also being crucial to ecosystem stability [38,39,40]. According to Güsewell’s research, soil C buildup and the limiting effects of N and P components can significantly affect how vegetation changes over time [41]. Therefore, predicting diversity shifts, deciphering nutrient cycling mechanisms, and developing effective management and revegetation strategies all require an understanding of how β-diversity fluctuates over time and how it relates to soil stoichiometric characteristics [36,42].
Therefore, this investigation was conducted in a perfect natural testing environment found in a temperate zone (Ziwuling region of the Loess Plateau, China). The vegetation in the Ziwuling area has been undergoing a natural recovery process for more than 150 years, with some of the territory having reached the top climax stage as a result [43]. Well-functioning plant communities, which are important for evaluating the mechanisms of community assembly and diversity maintenance, can spontaneously form due to the natural succession process [44,45]. This study analyzed the variation in species composition across different stages of vegetation restoration in this area, using a combination of taxonomic and phylogenetic methods, and provides an answer to the correlation between β-diversity and soil stoichiometry. Compared to taxonomic β-diversity, phylogenetic β-diversity is able to show how a species evolved and how closely related it is to other species. Therefore, it provides information on how species compete with each other in groups [46]. Herein, we aim to answer the following research questions: (1) What are the characteristics of changes in the assemblage and β-diversity of plant communities in temperate zones at different stages of long-term vegetation recovery? (2) How do soil C:N:P stoichiometry characteristics vary at different stages of recovery? (3) What are the links between plant community β-diversity, soil C:N:P stoichiometry, time since vegetation restoration (TVR; in years), and endemic plants at each stage (SS)? This study combines plant nutrient requirements with their response to natural recovery times, thereby offering valuable information for biodiversity conservation and preservation as well as for ecological function restoration.

2. Materials and Methods

2.1. The Study Sites and Approach

This research was conducted in the Ziwuling Nature Reserve, which is located in the temperate Loess Plateau area of China (34°50′–36°50′ N, 107°30′–109°40′ E) (Figure 1a). Over the past 150 years, since humans began to reduce their activity in this area as of 1866, vegetation has recovered to create a densely forested temperate natural secondary forest setting [43]. Eight standard square sample plots of typical vegetation types (trees, 20 × 20 m; shrubs, 10 × 10 m; grass, 1 × 1 m; [47]) for various restoration periods were established between 2020 and 2021 (Figure 1b), using a “space for time” strategy [48], with six sites for each phase (random vegetation sampling), across a total of 48 sites. The specific information is shown in the Supplementary Materials (Table S1). Recovery time was determined using a comprehensive analysis based on the results of the relevant forestry department and other relevant reports [49,50,51,52,53]. The names and numbers of the species at each sample site were recorded, and the species names were carefully cross checked at https://powo.science.kew.org/ (accessed on 25 December 2022) and the Flora of China [54].

2.2. Soil Sampling and Laboratory Analyses

In this study, soil samples were obtained from the 0–40 cm soil layer using a soil borehole sampler, with four replicates of each type of soil sample. After natural air-drying to remove plant roots and other impurities, soil organic carbon (SOC), total nitrogen (TN), and total phosphorus (TP) were measured [55]. The H2SO4-K2Cr2O7 [56], Kjeldahl [57], and ammonium molybdate methods [58] were used to determine the SOC, TN, and TP, respectively. The bulk density (BD) of the soil was also determined using the cutting ring method.

2.3. Data Processing

The Bray–Curtis dissimilarity index, which measures the dissimilarity (dab) of community components across sample sites with varying recovery times, was used in this study to compute taxonomic β-diversity (Equation (1)) [59,60].
d a b = 1 2 A 2 A + B + C
where A represents the number of species present in samples a and b; B represents the number of species specific to sample a; and C represents the number of species specific to sample b.
The R package V. PhylloMakert 2 (build.nodes.1 and scenario 3) was used to generate species-level phylogenetic trees based on the evolutionary tree of Jin and Qian [61]. The picante package was used to compute the phylogenetic β-diversity between sample sites [62], that is, the mean pairwise distance (MPD; Equation (2)) and the mean nearest taxon distance (MNTD; Equation (3)) [63].
MPD = 1 2 ( i = 1 n a f i d ib ¯ + j = 1 n b f j d ja ¯ )
MNTD = 1 2 ( i = 1 n a f i m i n d ib + j = 1 n b f j m i n d ja )
where species i is not equal to species j; dib is the mean pairwise phylogenetic distance (MPD) between species i from sample a and all species from sample b; na represents the number of species in sample a; fi represents the relative abundance of species i in sample a; and mindib represents the mean nearest taxon phylogenetic distance (MNTD) between species i in sample a and all species in sample b. Additionally, MPD reflects the degree of aggregation of different taxa near the root node of the phylogenetic tree, whereas MNTD reflects the degree of aggregation near the terminal branch [64].
SOC, TN, and TP stocks (g/m2) were calculated using Equation (4):
Soil SOC, TN, or TP stock = X. × BD × T × 10
where X. is the soil organic carbon (SOC), total nitrogen (TN), of total phosphorus (TP) content of the soil (g/kg), BD is the density of the bulk soil (g/cm3), and T is the soil layer thickness (cm).

2.4. Statistical Analysis

A polynomial fit was performed to better understand how the β-diversity index of plant communities changed over time after restoration. Prior to the analysis, we ensured that all data were adequate by checking for normality and homogeneity of variance. Any data that did not fit these assumptions were transformed using a logarithmic or power function. One-way analysis of variance (ANOVA) and Duncan’s test (p < 0.05) were used to compare SOC, TN, and TP content and their ratios across different stages of vegetation restoration. The significant effects of soil C:N:P stoichiometry, TVR (in years), and SS on β-diversity were analyzed using the Mantel test (9999 permutations), with correlations being evaluated using Pearson’s correlation analysis [60]. Redundancy analysis was subsequently used to further quantify the contributions of soil stoichiometry, TVR, and SS to β-diversity. IBM SPSS Statistics 24 (International Business Machine, NY, USA) and R 4.0.5 (R Foundation for Statistical Computing, Vienna, Austria) were used for all statistical analyses. The Venn diagram was constructed by using Bioinformatics and Evolutionary Genomics software (available at http://bioinformaics.psb.ugent.be/webtools/Venn/, accessed on 25 December 2022) (Ghent University, Ghent, Belgium) [65].

3. Results and Analysis

3.1. Differences in Vegetation Assemblage between Stages

In this study, it was found that the 150-year vegetation recovery sequence supported 128 species of seed plants (Table S2), which represented 39 families and 99 genera. The two most common types of flora were Carex lanceolata and Lespedeza bicolor, both of which were found in seven successional stages (10–150 TVR). Sophora davidii was found in six successional stages (20–150 TVR). The total of endemic plants contained in each stage (T-SS) showed an initial increase, followed by a downward trend, peaking at 70 TVR (Figure 2).

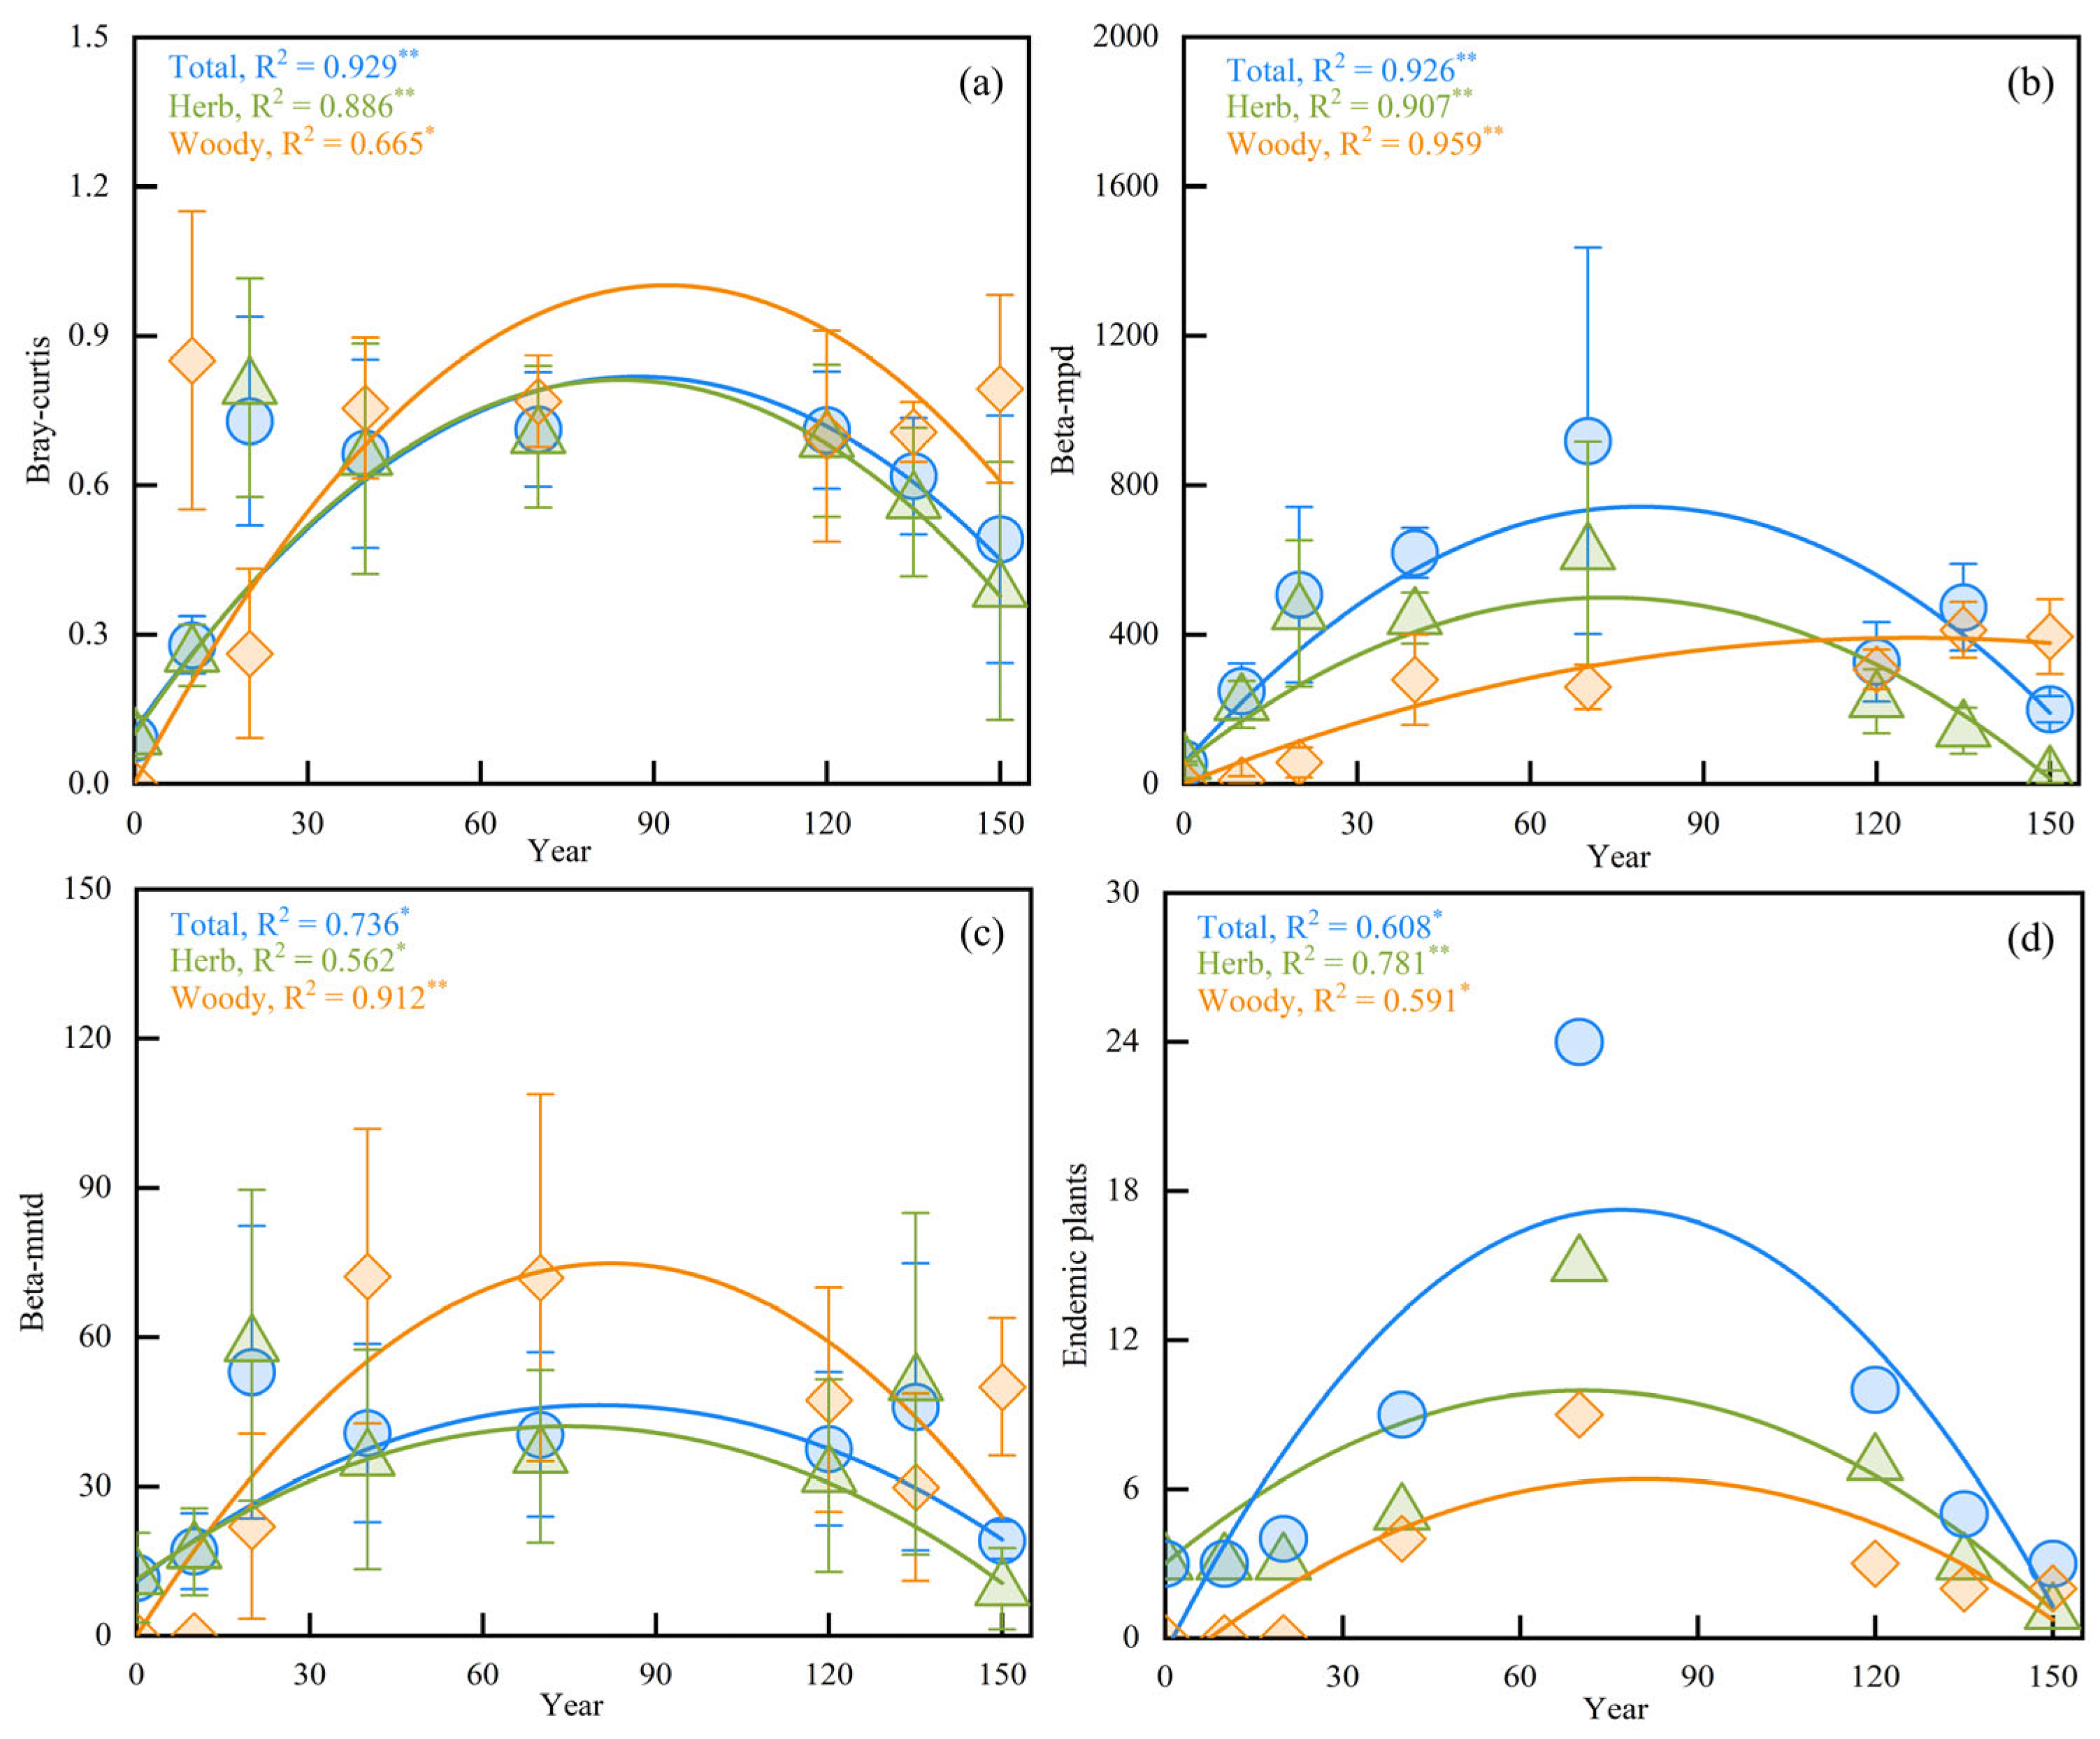
3.2. Beta Diversity and Endemic Plants in Different Stages

The number of species at different levels were examined in this study to determine how community taxonomic and phylogenetic β-diversity changed over time as a function of vegetation restoration age. As shown in Figure 3, the relationship between β-diversity and TVR exhibited a single peak over the 150 years analyzed. However, the peak period varied between 60 and 120 TVR, depending on the β-diversity index. All three β-diversity indices indicated that herb plants peaked earlier, followed by the total plant level, with woody plants peaking last. In addition, different levels of SS (endemic plants at each stage) also showed single peaks during the natural recovery of the vegetation.

3.3. Patterns of Soil C:N:P Stoichiometry in Different Stages

Soil C:N:P stoichiometric characteristics differed significantly among the different vegetation restoration periods (Figure 4). The SOC and TN reserves were significantly higher during all stages after vegetation restoration than in the farmland stage (0 years). The SOC and TN trends were similar, showing an initial increase, before decreasing. TP reserves were highest in the farmland stage and remained relatively constant afterwards. Soil C:N showed an overall increasing trend and was the highest at 150 TVR. In addition, the changes in C:P and N:P ratios were consistent, with highest soil C:P and N:P ratios being observed at 120 TVR.

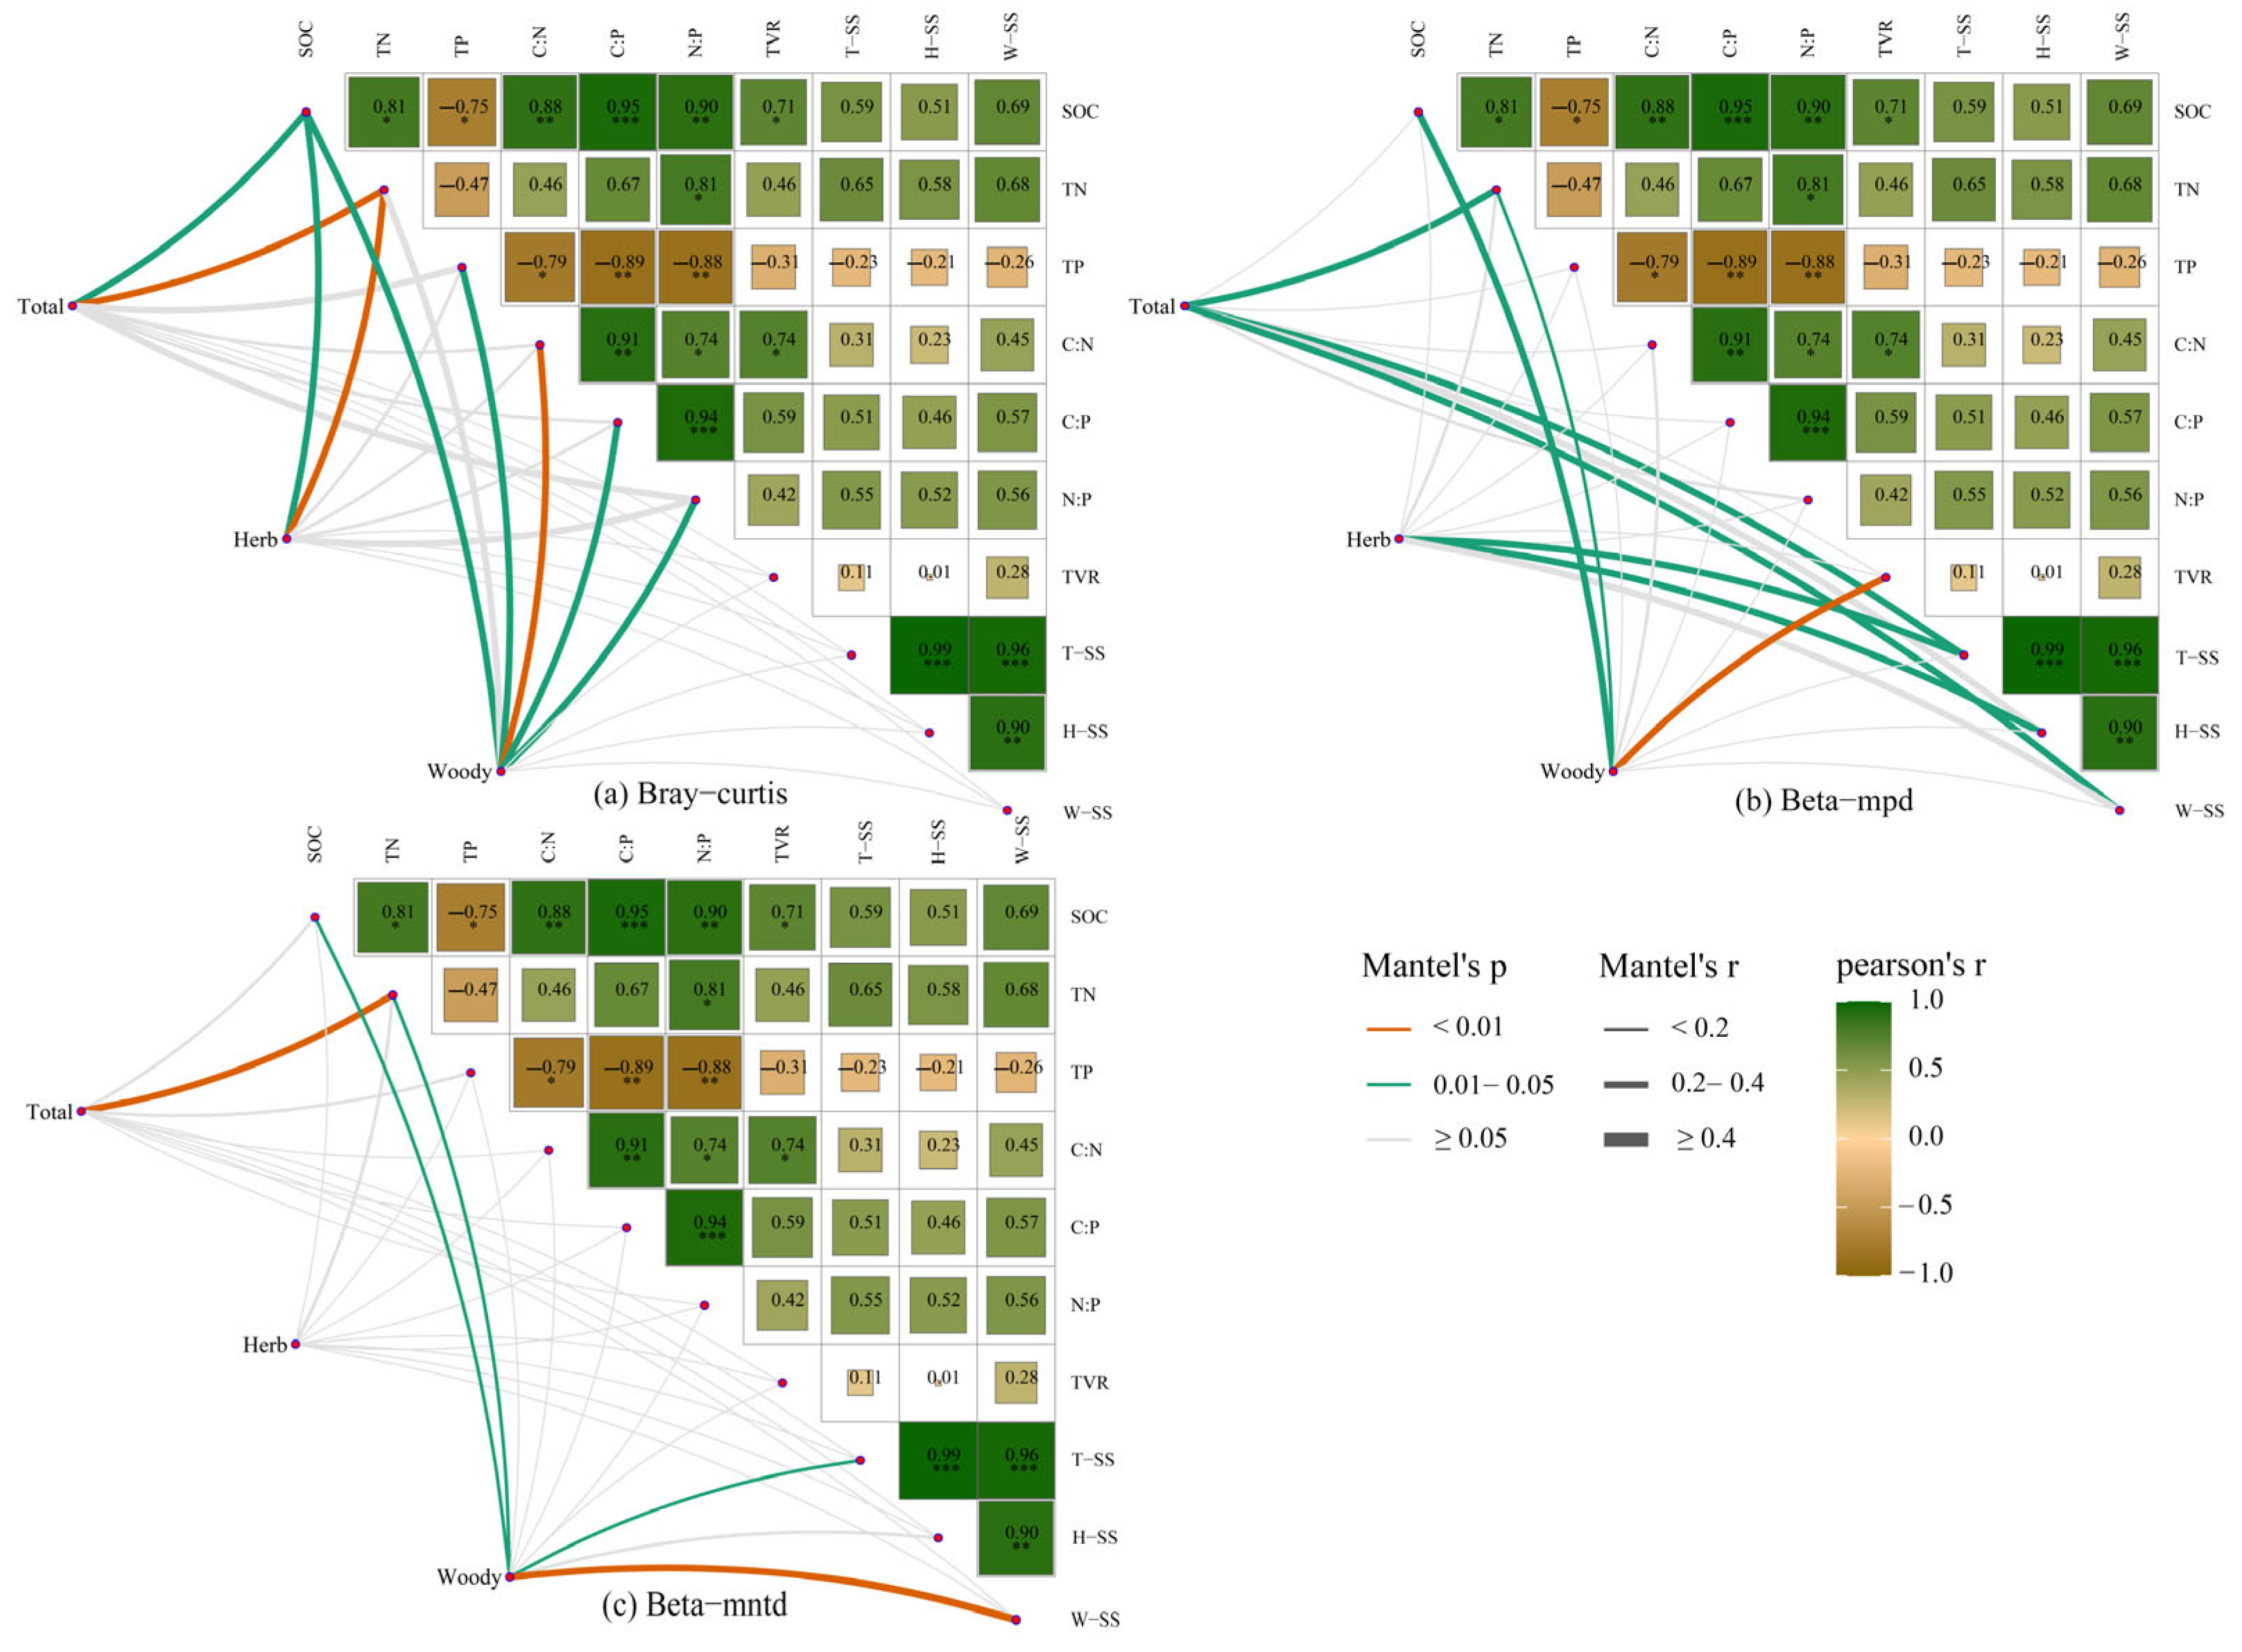
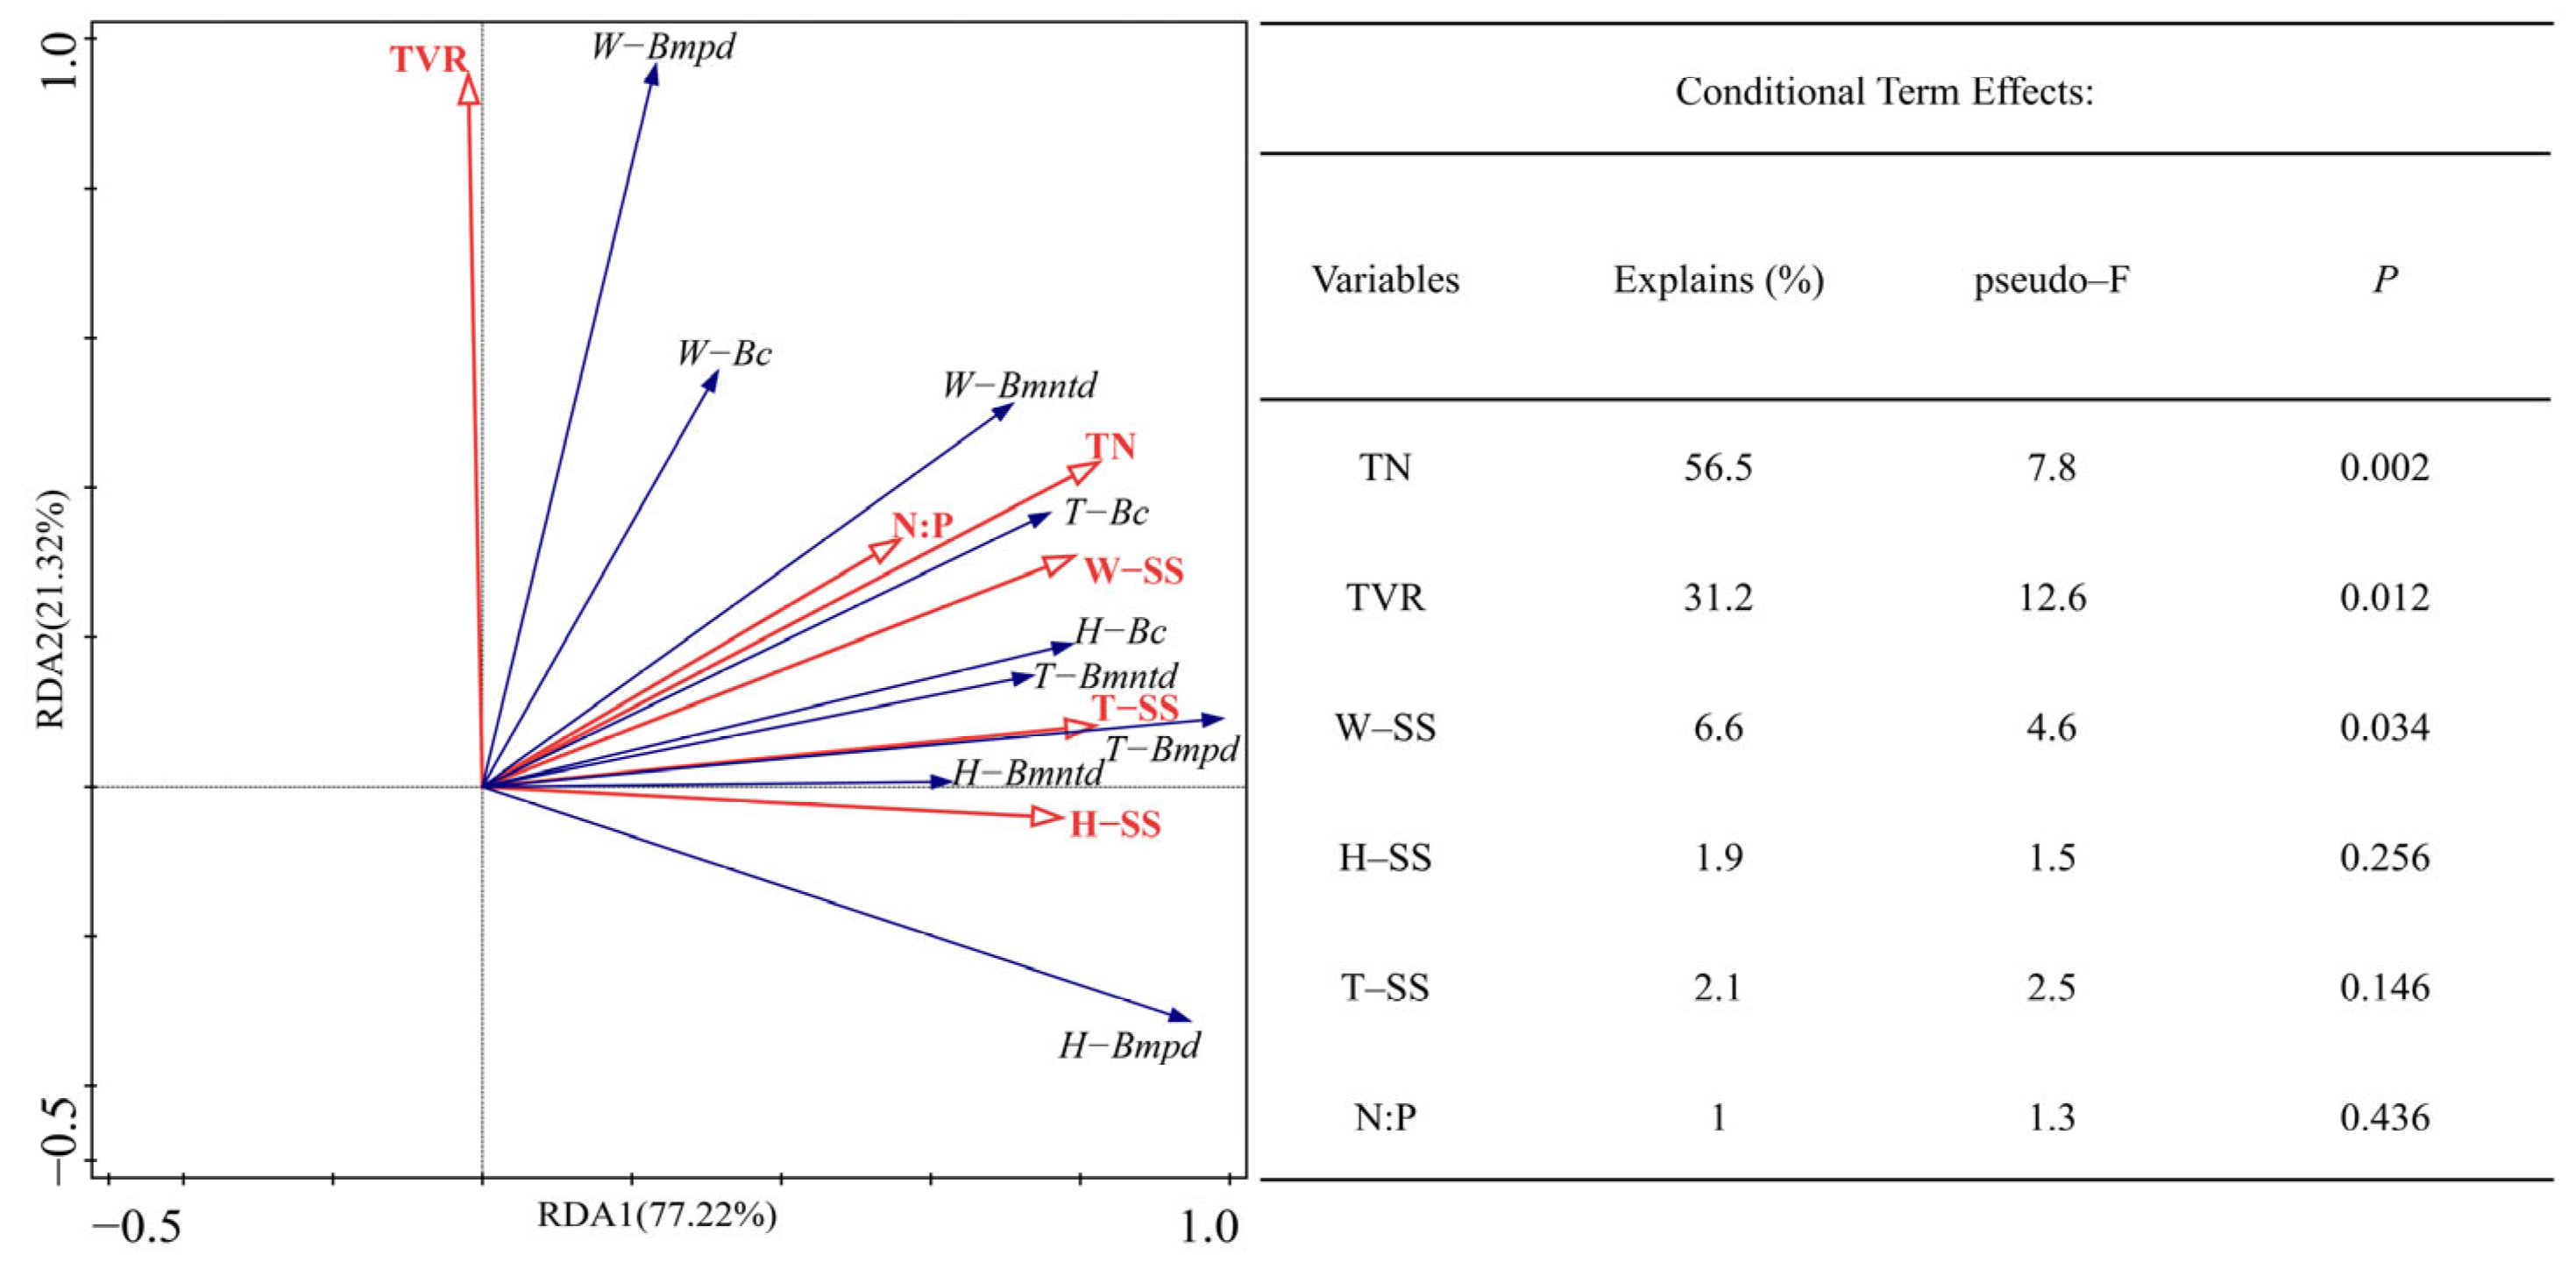
3.4. Relationship between Beta Diversity and Soil C:N:P Stoichiometry

The results of the Mantel test showed that the Bray–Curtis index of community β-diversity was significantly and positively correlated with both SOC and TN at the total plant and herb levels (p < 0.05, Figure 5a). This revealed that the difference in composition between total plant and herb levels in the community increased with the difference in SOC and TN at different periods. The Bray–Curtis index of woody plants was also significantly and positively correlated with SOC, TP, C:N, C:P, and N:P ratios (p < 0.05). The phylogenetic Beta-mpd index was significantly and positively correlated with TN, T-SS, and W-SS at the total plant level (p < 0.05, Figure 5b). Furthermore, T-SS and H-SS were significantly and positively correlated with the Beta-mpd index of the herb plants (p < 0.05). Beta-mpd indices of woody plants were also significantly and positively correlated with SOC, TN, and TVR (p < 0.05). The phylogenetic Beta-mntd index was highly significantly and positively correlated with TN at the total plant level (p < 0.05, Figure 5c). However, the Beta-mntd index of herb plants did not reach significant levels of correlation with soil stoichiometry, TVR, or SS. The Beta-mntd indices of woody plants were significantly and positively correlated with SOC, TN, T-SS, and W-SS (p < 0.05). In addition, strong correlations were found among the factors affecting changes in taxonomic and phylogenetic β-diversity. There was a strong consistency among the soil stoichiometry factors, although these were all negatively correlated with TP. In addition, vegetation restoration significantly increased SOC and C: N ratios in the soil.
The results of the redundancy analysis in Figure 6 showed that the total of soil stoichiometry, TVR, and W-SS explained 99.30% of the β-diversity, while the first and second axes explained 77.22% and 21.32% of the variation in β-diversity, respectively. After removing the conditional term effects, TN was the most important factor influencing the variation in β-diversity (56.5%), followed by TVR (31.2%) and W-SS (6.6%). All aforementioned indicators were significant (p < 0.05).

4. Discussion

4.1. Beta Diversity and Soil C:N:P Stoichiometry in Different Recovery Periods

After reviewing the geographic zoning of Chinese seed-plant genera, it was determined that Carex lanceolata, Lespedeza bicolor, and Sophora davidii are all temperate species, as described by Wu [66]. This seemed understandable, because the study area was located in the warm temperate deciduous broadleaf forest zone [67]. Meanwhile, 68.3% of all endemic species were found to be temperate in nature, after analysis across all stages. This indicated the superior adaptability of temperate species, which was the result of the long-term adaptive evolution of plants in response to historical and other factors [68]. The midterm stage of vegetation recovery (70 TVR) had the fewest globally distributed species compared with the early (0–40 TVR) and late (120–150 TVR) stages of recovery. This was related to the random dispersal capacity of the species [69]. Caccianiga et al. [70] also discovered that species with superior colonization ability typically predominate during the early stages of succession.
The results from measures of both β-diversity and endemic plants in this study supported a similar single-peak temporal pattern that was consistent with the intermediate succession hypothesis [71]. Several previous studies have also demonstrated that the patterns of β-diversity were not strictly linear [12,72,73]. According to Tang et al. [74], the decrease in surface air temperature in China during the 1950s–1960s was much more pronounced than globally or in the Northern Hemisphere, while the warming since the early 1980s did not appear to be more pronounced than that in the 1930s–1940s. This climate pattern was similar to our findings with endemic plants and β-diversity across time. Here, it was inferred that the TVR was indicative of the underlying changes in climatic patterns. González-Megías et al. [75] also discovered a gradual increase in temporal-scale β-diversity, which had been primarily influenced by the northward migration of species distribution as a result of global warming. Therefore, climate plays a significant role in determining species diversity variation between communities [76,77,78]. In addition, it was discovered in this study that woody plants excluded more than herbaceous plants among closely related species, but all herbaceous plants competed earlier and more intensely under broader genealogical relationships. This was because woody plants allowed for greater vertical ecological niche differentiation, thereby reducing competition between species with only tenuous evolutionary connections [79]. Plants use complementary ecological niches to access more resources, whilst the similarity and differentiation of species are both influenced by a wide range of community-building processes [80].
Nutrient-rich soil is critical for plant growth and development and also plays a role in shaping the composition and diversity of plant communities [81]. The results of this study showed that the soil C:N:P stoichiometric characteristics changed with TVR. Strong correlations were found between SOC and other stoichiometric features, while SOC increased significantly with increasing TVR. This was because plants affected SOC and TN through processes such as root secretion and apoplast decomposition [82,83]. The opposite was true for TP, which was significantly negatively correlated with SOC. This was because, while artificial addition affected TP during the farmland phase (0 years), the balance between plant uptake and soil matrix weathering processes determined TP during the other phases [84,85]. Increases in TVR led to higher soil C:N ratios, since plants absorbed nitrogen to increase their ability to release carbon into the soil through photosynthesis. N input has also been shown to promote SOC accumulation in an ever-growing body of research [41,86]. The C:P and N:P ratios in the soil increased and then decreased as the TVR increased. This was because the limiting effects of N or P on vegetation growth became less pronounced as C fixation increased, due to the high complementarity of plants in light acquisition [87,88]. At 135 TVR (mixed coniferous forest), lower soil C:N, C:P, and N:P ratios were observed compared to those at 120 TVR (coniferous forest), which was attributed primarily to competition among woody plants. Chen and Chen [39] found that species mixing could reduce the C:N, C:P, and N:P ratios when they were high in the background soil.

4.2. Relationships among Beta Diversity, Soil C:N:P Stoichiometry, Time since Vegetation Restoration, and Endemic Plants at Each Stage

The succession of plant communities occurs due to interactions between plants and soil, with soil properties playing a significant role in this process [37]. In addition to reflecting the outcomes of the symbiotic interaction between the community and the soil prior to a given successional stage, the status of soil nutrients at a given stage also determined subsequent succession [89]. Soil C:N:P stoichiometry is a significant indicator of soil nutrients [90,91]. In this study, β-diversity and soil C:N:P stoichiometric characteristics were both found to have had a strong correlation during the vegetation restoration process, using the Mantel test. Species may retouch ecological niches through priority effects, thereby creating favorable conditions for the growth and reproduction of members of the community that joined the ecosystem later [92,93]. Competition for scarce resources may be a major factor in shaping outbreaks of species diversity, as evidenced by the sharp increase in T-SS from 40 to 70 TVR. This fit with Clements’ classical view of succession and is a characteristic of the promotion model [94]. There appears to be a universal pattern in nature, while Hanusch et al. [73] suggested that there may be a threshold for ecosystem development between 40 and 60 years.
Additionally, redundancy analysis (RDA) confirmed that soil TN, TVR, and W-SS were the primary factors explaining the variation in β-diversity (94.3% total). Collectively, these elements serve as regulators of the β-diversity shifts, and these results are in agreement with those reported by Villa et al. [95]. The strongest explanatory power was found for soil TN, indicating that soil nutrients played a significant role in species allocation at a local scale [20,96]. Unfortunately, these criteria alone could not be used to quantitatively distinguish between deterministic and stochastic processes, because various ecological processes may result in similar outcomes [97]. Changes in species composition may result from a combination of deterministic (e.g., species adaptation to climate or soil nutrient differences) and stochastic (e.g., restricted dispersal) processes, with delayed responses of some species to climate change or other historical processes also playing a role. Additionally, these factors fluctuate dynamically during plant–soil feedback, which can affect species coexistence [98].
It is clear that various processes interact to produce β-diversity patterns [99]. It is important to remember that during the vegetation succession of the Loess Plateau, evolutionary history was embedded in the community assembly process. The historical-evolutionary hypothesis can account for this [100,101]. Carex lanceolata, Lespedeza bicolor, and Sophora davidii can live alongside other species for a long time and play important ecological roles, such as fixing nitrogen and preventing soil erosion [102,103]. Therefore, these plants all have significant biohistorical value. The rate of recovery of Loess Plateau vegetation can be increased by raising the prevalence of these three plants while keeping C, N, and P inputs under reasonable control. Species dispersal, environmental filtering, biological interactions, evolutionary processes, climatic and geological history, and possibly other unknown processes all contributed to the temporal patterns of plant community β-diversity observed in this study. It is suggested that in the future, long-term continuous observations be carried out and that more data be collected on environmental factors and biodiversity across a range of trophic levels, to facilitate integrated studies.

5. Conclusions

Ecological and evolutionary processes largely shape variations in the species composition within a community. The formation of a temporal pattern of single peaks in β-diversity and accumulation of SOC was critically dependent on the limiting effect of N or P. Species with high dispersal ability can provide conditions for explosive growth in species diversity by increasing soil nutrient accumulation through facilitative effects. Temperate species form the basis of the community, and they can improve resource capture capacity by reducing competition through spatially differentiated ecological niches. Plants such as Carex lanceolata, Lespedeza bicolor, and Sophora davidii all have significant biohistorical value and should therefore be considered for future vegetation restoration projects on the Loess Plateau. More biotic and abiotic factors should be included in future studies to quantitatively distinguish the contribution of different processes to β-diversity. This will aid in the complete elucidation of the mechanisms by which temperate plant communities maintain their biodiversity.

Supplementary Materials

The following supporting information can be downloaded at: https://www.mdpi.com/article/10.3390/f14030553/s1, Table S1: Vegetation survey sample site information at the Ziwuling study area on the Chinese Loess Plateau; Table S2: The 128 species of seed plants included in the vegetation restoration sequence of this study.

Author Contributions

Conceptualization, Q.T. and X.Z.; methodology, Q.T. and X.Z.; software, Q.T.; formal analysis, Q.T.; investigation, Q.T., X.Z., X.X., H.Y., J.H., L.H.; data curation, Q.T. and X.X.; writing—original draft preparation, Q.T.; writing—review and editing, Q.T. and X.Z.; visualization, Q.T.; project administration and funding acquisition, X.Z. All authors have read and agreed to the published version of the manuscript.

Funding

This research was funded by the National Key R&D Program of China (2022YFE0115300) and National Natural Science Foundation of China, grant number 41877083, 41440012 and 41230852.

Data Availability Statement

Data are contained within the article or Supplementary Materials.

Acknowledgments

We would like to thank Haojia Wang, Miaoqian Wang, Yujie Zhang, Fan Xue, and Yadong Zou for help with data processing and discussion for this article.

Conflicts of Interest

The authors declare no conflict of interest.

References

  1. Joly, C.A. The Kunming-Montréal Global Biodiversity Framework. Biota Neotrop. 2023, 22, e2022e001. [Google Scholar] [CrossRef]
  2. Soto-Navarro, C.A.; Harfoot, M.; Hill, S.L.L.; Campbell, J.; Mora, F.; Campos, C.; Pretorius, C.; Pascual, U.; Kapos, V.; Allison, H. Towards a multidimensional biodiversity index for national application. Nat. Sustain. 2021, 4, 933–942. [Google Scholar] [CrossRef]
  3. Nicholson, E.; Watermeyer, K.E.; Rowland, J.A.; Sato, C.F.; Stevenson, S.L.; Andrade, A.; Brooks, T.M.; Burgess, N.D.; Cheng, S.-T.; Grantham, H.S.; et al. Scientific foundations for an ecosystem goal, milestones and indicators for the post-2020 global biodiversity framework. Nat. Ecol. Evol. 2021, 5, 1338–1349. [Google Scholar] [CrossRef] [PubMed]
  4. Isbell, F.; Cowles, J.; Dee, L.E.; Loreau, M.; Reich, P.B.; Gonzalez, A.; Hector, A.; Schmid, B. Quantifying effects of biodiversity on ecosystem functioning across times and places. Ecol. Lett. 2018, 21, 763–778. [Google Scholar] [CrossRef] [Green Version]
  5. Craven, D.; Eisenhauer, N.; Pearse, W.D.; Hautier, Y.; Isbell, F.; Roscher, C.; Bahn, M.; Beierkuhnlein, C.; Bönisch, G.; Buchmann, N.; et al. Multiple facets of biodiversity drive the diversity–stability relationship. Nat. Ecol. Evol. 2018, 2, 1579–1587. [Google Scholar] [CrossRef] [PubMed] [Green Version]
  6. Anderson, M.J.; Crist, T.O.; Chase, J.M.; Vellend, M.; Inouye, B.D.; Freestone, A.L.; Sanders, N.J.; Cornell, H.V.; Comita, L.S.; Davies, K.F.; et al. Navigating the multiple meanings of β diversity: A roadmap for the practicing ecologist. Ecol. Lett. 2011, 14, 19–28. [Google Scholar] [CrossRef]
  7. Le Provost, G.; Schenk, N.V.; Penone, C.; Thiele, J.; Westphal, C.; Allan, E.; Ayasse, M.; Blüthgen, N.; Boeddinghaus, R.S.; Boesing, A.L.; et al. The supply of multiple ecosystem services requires biodiversity across spatial scales. Nat. Ecol. Evol. 2022, 7, 236–249. [Google Scholar] [CrossRef] [PubMed]
  8. Whittaker, R.H. Vegetation of the Siskiyou mountains, Oregon and California. Ecol. Monogr. 1960, 30, 279–338. [Google Scholar] [CrossRef]
  9. Condit, R.; Pitman, N.; Leigh, E.G., Jr.; Chave, J.; Terborgh, J.; Foster, R.B.; Nu, P.; Aguilar, S.; Valencia, R.; Hubbell, S.P. Beta-diversity in tropical forest trees. Science 2002, 295, 666–669. [Google Scholar] [CrossRef] [Green Version]
  10. Socolar, J.B.; Gilroy, J.J.; Kunin, W.E.; Edwards, D.P. How should beta-diversity inform biodiversity conservation? Trends Ecol. Evol. 2016, 31, 67–80. [Google Scholar] [CrossRef] [Green Version]
  11. Mori, A.S.; Isbell, F.; Seidl, R. β-diversity, community assembly, and ecosystem functioning. Trends Ecol. Evol. 2018, 33, 549–564. [Google Scholar] [CrossRef]
  12. Reu, J.C.; Catano, C.P.; Spasojevic, M.J.; Myers, J.A. Beta diversity as a driver of forest biomass across spatial scales. Ecology 2022, 103, e3774. [Google Scholar] [CrossRef] [PubMed]
  13. Weiher, E.; Freund, D.; Bunton, T.; Stefanski, A.; Lee, T.; Bentivenga, S. Advances, challenges and a developing synthesis of ecological community assembly theory. Philos. Trans. R. Soc. B Biol. Sci. 2011, 366, 2403–2413. [Google Scholar] [CrossRef]
  14. Myers, J.A.; Chase, J.M.; Jiménez, I.; Jorgensen, P.M.; Araujo-Murakami, A.; Paniagua-Zambrana, N.; Seidel, R. Beta- diversity in temperate and tropical forests reflects dissimilar mechanisms of community assembly. Ecol. Lett. 2013, 16, 151–157. [Google Scholar] [CrossRef] [PubMed]
  15. Münkemüller, T.; Gallien, L.; Pollock, L.J.; Barros, C.; Carboni, M.; Chalmandrier, L.; Mazel, F.; Mokany, K.; Roquet, C.; Smyčka, J.; et al. Dos and don’ts when inferring assembly rules from diversity patterns. Glob. Ecol. Biogeogr. 2020, 29, 1212–1229. [Google Scholar] [CrossRef] [Green Version]
  16. Leibold, M.A.; Holyoak, M.; Mouquet, N.; Amarasekare, P.; Chase, J.M.; Hoopes, M.F.; Holt, R.D.; Shurin, J.B.; Law, R.; Tilman, D.; et al. The metacommunity concept: A framework for multi-scale community ecology. Ecol. Lett. 2004, 7, 601–613. [Google Scholar] [CrossRef]
  17. Kraft, N.J.; Adler, P.B.; Godoy, O.; James, E.C.; Fuller, S.; Levine, J.M. Community assembly, coexistence and the environmental filtering metaphor. Funct. Ecol. 2015, 29, 592–599. [Google Scholar] [CrossRef]
  18. Chave, J. Neutral theory and community ecology. Ecol. Lett. 2004, 7, 241–253. [Google Scholar] [CrossRef]
  19. Hubbell, S.P. The unified neutral theory of biodiversity and biogeography (MPB-32). In The Unified Neutral Theory of Biodiversity and Biogeography (MPB-32); Princeton University Press: Princeton, NJ, USA, 2011. [Google Scholar] [CrossRef]
  20. Chase, J.M.; Myers, J.A. Disentangling the importance of ecological niches from stochastic processes across scales. Philos. Trans. R. Soc. B Biol. Sci. 2011, 366, 2351–2363. [Google Scholar] [CrossRef] [Green Version]
  21. Bellier, E.; Grøtan, V.; Engen, S.; Schartau, A.K.; Herfindal, I.; Finstad, A.G. Distance decay of similarity, effects of environmental noise and ecological heterogeneity among species in the spatio-temporal dynamics of a dispersal-limited community. Ecography 2014, 37, 172–182. [Google Scholar] [CrossRef]
  22. Wang, J.; Wang, Y.; Li, M.; He, N.; Li, J. Divergent roles of environmental and spatial factors in shaping plant β-diversity of different growth forms in drylands. Glob. Ecol. Conserv. 2021, 26, e01487. [Google Scholar] [CrossRef]
  23. Jiang, L.; Hu, D.; Wang, H.; Lv, G. Discriminating ecological processes affecting different dimensions of α-and β-diversity in desert plant communities. Ecol. Evol. 2022, 12, e8710. [Google Scholar] [CrossRef]
  24. Wang, Z.; Fang, J.; Tang, Z.; Shi, L. Geographical patterns in the beta diversity of China’s woody plants: The influence of space, environment and range size. Ecography 2012, 35, 1092–1102. [Google Scholar] [CrossRef] [Green Version]
  25. Fitzpatrick, M.C.; Sanders, N.J.; Normand, S.; Svenning, J.C.; Ferrier, S.; Gove, A.D.; Dunn, R.R. Environmental and historical imprints on beta diversity: Insights from variation in rates of species turnover along gradients. Proc. R. Soc. B Biol. Sci. 2013, 280, 20131201. [Google Scholar] [CrossRef] [PubMed] [Green Version]
  26. Murphy, S.J.; Salpeter, K.; Comita, L.S. Higher β-diversity observed for herbs over woody plants is driven by stronger habitat filtering in a tropical understory. Ecology 2016, 97, 2074–2084. [Google Scholar] [CrossRef]
  27. Su, L.; Du, H.; Zeng, F.; Peng, W.; Wang, H.; Wang, K.; Lu, M. Environmental and spatial contributions to tree community assembly across life stages and scales in evergreen-deciduous broadleaf karst forests, southwest China. J. For. Res. 2022, 1–9. [Google Scholar] [CrossRef]
  28. Hu, D.; Jiang, L.; Hou, Z.; Zhang, J.; Wang, H.; Lv, G. Environmental filtration and dispersal limitation explain different aspects of beta diversity in desert plant communities. Glob. Ecol. Conserv. 2022, 33, e01956. [Google Scholar] [CrossRef]
  29. Hua, F.; Bruijnzeel, L.A.; Meli, P.; Martin, P.A.; Zhang, J.; Nakagawa, S.; Miao, X.; Wang, W.; Mcevoy, C.; Balmford, A. The biodiversity and ecosystem service contributions and trade-offs of forest restoration approaches. Science 2022, 376, 839–844. [Google Scholar] [CrossRef]
  30. Pennisi, E. How to regrow a forest? Scientists aren’t sure. Science 2022, 378, 816–817. [Google Scholar] [CrossRef]
  31. Wu, N.; Qu, Y.; Guse, B.; Makarevičiūtė, K.; To, S.; Riis, T.; Fohrer, N. Hydrological and environmental variables outperform spatial factors in structuring species, trait composition, and beta diversity of pelagic algae. Ecol. Evol. 2018, 8, 2947–2961. [Google Scholar] [CrossRef]
  32. Qu, Y.; Wu, N.; Guse, B.; Makarevičiūtė, K.; Sun, X.; Fohrer, N. Riverine phytoplankton functional groups response to multiple stressors variously depending on hydrological periods. Ecol. Indic. 2019, 101, 41–49. [Google Scholar] [CrossRef] [Green Version]
  33. Finderup Nielsen, T.; Sand-Jensen, K.; Dornelas, M.; Bruun, H.H. More is less: Net gain in species richness, but biotic homogenization over 140 years. Ecol. Lett. 2019, 22, 1650–1657. [Google Scholar] [CrossRef]
  34. Blowes, S.A.; Supp, S.R.; Antão, L.H.; Bates, A.; Bruelheide, H.; Chase, J.M.; Moyes, F.; Magurran, A.; Mcgill, B.; Dornelas, M. The geography of biodiversity change in marine and terrestrial assemblages. Science 2019, 366, 339–345. [Google Scholar] [CrossRef] [Green Version]
  35. Lindholm, M.; Alahuhta, J.; Heino, J.; Toivonen, H. Temporal beta diversity of lake plants is determined by concomitant changes in environmental factors across decades. J. Ecol. 2021, 109, 819–832. [Google Scholar] [CrossRef]
  36. Wu, N.; Wang, Y.; Wang, Y.; Sun, X.; Faber, C.; Fohrer, N. Environment regimes play an important role in structuring trait-and taxonomy-based temporal beta diversity of riverine diatoms. J. Ecol. 2022, 110, 1442–1454. [Google Scholar] [CrossRef]
  37. West, D.C.; Shugart, H.H.; Botkin, D.F. (Eds.) Forest Succession: Concepts and Application; Springer Science & Business Media: Berlin/Heidelberg, Germany, 2012. [Google Scholar]
  38. Sardans, J.; Rivas-Ubach, A.; Peñuelas, J. The C: N: P stoichiometry of organisms and ecosystems in a changing world: A review and perspectives. Perspect. Plant Ecol. Evol. Syst. 2012, 14, 33–47. [Google Scholar] [CrossRef]
  39. Chen, X.; Chen, H.Y. Plant mixture balances terrestrial ecosystem C: N: P stoichiometry. Nat. Commun. 2021, 12, 4562. [Google Scholar] [CrossRef]
  40. Lu, J.; Feng, S.; Wang, S.; Zhang, B.; Ning, Z.; Wang, R.; Chen, X.; Yu, L.; Zhao, H.; Lan, D.; et al. Patterns and driving mechanism of soil organic carbon, nitrogen, and phosphorus stoichiometry across northern China’s desert-grassland transition zone. Catena 2023, 220, 106695. [Google Scholar] [CrossRef]
  41. Güsewell, S. N: P ratios in terrestrial plants: Variation and functional significance. New Phytol. 2004, 164, 243–266. [Google Scholar] [CrossRef]
  42. He, Y.; Liang, S.; Liu, R.; Jiang, Y. Beta diversity patterns unlock the community assembly of woody plant communities in the riparian zone. Forests 2022, 13, 673. [Google Scholar] [CrossRef]
  43. Tian, Q.; Zhang, X.; Xu, X.; Yi, H.; He, J.; He, L.; Sun, W. Knowledge about Plant Coexistence during Vegetation Succession for Forest Management on the Loess Plateau, China. Forests 2022, 13, 1456. [Google Scholar] [CrossRef]
  44. Lohbeck, M.; Poorter, L.; Lebrija-Trejos, E.; Martínez-Ramos, M.; Meave, J.A.; Paz, H.; Pérez-García, E.A.; Romero-Pérez, I.E.; Tauro, A.; Bongers, F. Successional changes in functional composition contrast for dry and wet tropical forest. Ecology 2013, 94, 1211–1216. [Google Scholar] [CrossRef]
  45. Li, T.; Wu, M.; Duan, C.; Li, S.; Liu, C. The effect of different restoration approaches on vegetation development in metal mines. Sci. Total Environ. 2022, 806, 150626. [Google Scholar] [CrossRef] [PubMed]
  46. Li, F.; Yan, Y.; Zhang, J.; Zhang, Q.; Niu, J. Taxonomic, functional, and phylogenetic beta diversity in the Inner Mongolia grassland. Glob. Ecol. Conserv. 2021, 28, e01634. [Google Scholar] [CrossRef]
  47. Fang, J.Y.; Zhu, J.L.; Guo, Z.D.; Wang, X.; Shen, Z.; Tang, Z.; He, J.; Yu, D.; Jiang, Y.; Wang, Z.; et al. Methods and protocols for plant community inventory. Biodivers. Sci. 2009, 17, 533–548. [Google Scholar] [CrossRef]
  48. Blois, J.L.; Williams, J.W.; Fitzpatrick, M.C.; Jackson, S.T.; Ferrier, S. Space can substitute for time in predicting climate-change effects on biodiversity. Proc. Natl. Acad. Sci. USA 2013, 110, 9374–9379. [Google Scholar] [CrossRef] [Green Version]
  49. Zou, H.Y.; Liu, G.B.; Wang, H.S. The vegetation development in North Ziwuling forest region in last fifty years. Acta Botan. Boreali-Occiden. Sin. 2002, 22, 1–8. (In Chinese) [Google Scholar]
  50. Fan, W.Y.; Wang, X.A.; Guo, H. Analysis of plant community successional series in the Ziwuling area on the Loess Plateau. Acta Ecol. Sin. 2006, 26, 706–714. (In Chinese) [Google Scholar]
  51. Deng, L.; Wang, K.B.; Chen, M.L.; Shangguan, Z.P.; Sweeney, S. Soil organic carbon storage capacity positively related to forest succession on the Loess Plateau, China. Catena 2013, 110, 1–7. [Google Scholar] [CrossRef]
  52. Zhao, Y.G.; Liu, X.F.; Wang, Z.L.; Zhao, S.W. Soil organic carbon fractions and sequestration across a 150-yr secondary forest chronosequence on the Loess Plateau, China. Catena 2015, 133, 303–308. [Google Scholar] [CrossRef]
  53. Liu, Y.; Zhu, G.; Hai, X.; Li, J.; Shangguan, Z.P.; Peng, C.; Deng, L. Long-term Forest succession improves plant diversity and soil quality but not significantly increase soil microbial diversity: Evidence from the Loess Plateau. Ecol. Eng. 2020, 142, 105631. [Google Scholar] [CrossRef]
  54. Li, J. Flora of China. Harv. Pap. Bot. 2007, 13, 301–302. [Google Scholar] [CrossRef]
  55. Haq, S.M.; Tariq, A.; Li, Q.; Yaqoob, U.; Majeed, M.; Hassan, M.; Fatima, S.; Fatima, S.; Bussmann, R.W.; Moazzam, M.F.U.; et al. Influence of Edaphic Properties in Determining Forest Community Patterns of the Zabarwan Mountain Range in the Kashmir Himalayas. Forests 2022, 13, 1214. [Google Scholar] [CrossRef]
  56. Nelson, D.W.; Sommers, L.E. Total carbon, organic carbon and organic matter. In Methods of Soil Analysis Part 3—Chemical Methods; American Society of Agronomy, Inc.: Madison, WI, USA, 1996; Volume 5, pp. 961–1010. [Google Scholar] [CrossRef]
  57. Bremner, J.M. Nitrogen-total. In Methods of Soil Analysis: Part 3 Chemical Methods; American Society of Agronomy, Inc.: Madison, WI, USA, 1996; Volume 5, pp. 1085–1121. [Google Scholar] [CrossRef]
  58. Schimel, J.P.; Weintraub, M.N. The implications of exoenzyme activity on microbial carbon and nitrogen limitation in soil: A theoretical model. Soil Biol. Biochem. 2003, 35, 549–563. [Google Scholar] [CrossRef]
  59. Legendre, P.; De Cáceres, M. Beta diversity as the variance of community data: Dissimilarity coefficients and partitioning. Ecol. Lett. 2013, 16, 951–963. [Google Scholar] [CrossRef]
  60. Oksanen, J.; Blanchet, F.G.; Friendly, M.; Kindt, R.; Legendre, P.; McGlinn, D.; Minchin, P.R.; O’Hara, R.B.; Simpson, G.L.; Soly-mos, P.; et al. Vegan: Community Ecology Package. R package version 2.5-6. 2019. Available online: https://CRAN.R-project.org/package=vegan (accessed on 28 May 2021).
  61. Jin, Y.; Qian, H.V. PhyloMaker2: An updated and enlarged R package that can generate very large phylogenies for vascular plants. Plant Divers. 2022, 44, 335–339. [Google Scholar] [CrossRef]
  62. Kembel, S.W.; Cowan, P.D.; Helmus, M.R.; Cornwell, W.K.; Morlon, H.; Ackerly, D.D.; Blomberg, S.P.; Webb, C.O. Picante: R tools for integrating phylogenies and ecology. Bioinformatics 2010, 26, 1463–1464. [Google Scholar] [CrossRef] [Green Version]
  63. Webb, C.O.; Ackerly, D.D.; Kembel, S.W. Phylocom: Software for the analysis of phylogenetic community structure and trait evolution. Bioinformatics 2008, 24, 2098–2100. [Google Scholar] [CrossRef] [Green Version]
  64. Webb, C.O. Exploring the phylogenetic structure of ecological communities: An example for rain forest trees. Am. Nat. 2000, 156, 145–155. [Google Scholar] [CrossRef]
  65. Haq, S.M.; Calixto, E.S.; Rashid, I.; Khuroo, A.A. Human-driven disturbances change the vegetation characteristics of temperate forest stands: A case study from Pir Panchal Mountain range in Kashmir Himalaya. Trees For. People 2021, 6, 100134. [Google Scholar] [CrossRef]
  66. Wu, Z.Y. Distribution type of seed plant genera in China. Kunming: Yunnan Plant Research. Acta Bot. Yunnanica Supp. IV 1991, 1–139. (In Chinese) [Google Scholar]
  67. Hou, X. 1:1 Million Vegetation Map of China; National Tibetan Plateau Data Center: Beijing, China, 2019. (In Chinese) [Google Scholar]
  68. Tian, Q.L.; Xu, X.M.; Lyu, D.; Wang, H.J.; Lei, S.Y.; Yi, H.J.; He, J.; He, L.; Xue, F.; Zhou, Y.D.; et al. Relationship between geographical pattern of plant diversity and environmental factors in Beiluo River Basin. China Environ. Sci. 2021, 41, 4378–4387. (In Chinese) [Google Scholar]
  69. Catano, C.P.; Dickson, T.L.; Myers, J.A. Dispersal and neutral sampling mediate contingent effects of disturbance on plant beta-diversity: A meta-analysis. Ecol. Lett. 2017, 20, 347–356. [Google Scholar] [CrossRef]
  70. Caccianiga, M.; Luzzaro, A.; Pierce, S.; Ceriani, R.M.; Cerabolini, B. The functional basis of a primary succession resolved by CSR classification. Oikos 2006, 112, 10–20. [Google Scholar] [CrossRef]
  71. Bazzaz, F.A. Plants in Changing Environments: Linking Physiological, Population, and Community Ecology; Cambridge University Press: Cambridge, UK, 1996. [Google Scholar]
  72. Abbas, S.; Nichol, J.E.; Zhang, J.; Fischer, G.A. The accumulation of species and recovery of species composition along a 70-year succession in a tropical secondary forest. Ecol. Indic. 2019, 106, 105524. [Google Scholar] [CrossRef]
  73. Hanusch, M.; He, X.; Ruiz-Hernández, V.; Junker, R.R. Succession comprises a sequence of threshold-induced community assembly processes towards multidiversity. Commun. Biol. 2022, 5, 424. [Google Scholar] [CrossRef]
  74. Tang, G.L.; Ren, G.Y. Reanalysis of Surface Air Temperature Change of the Last 100 Years over China. Clim. Environ. Res. 2005, 4, 791–798. (In Chinese) [Google Scholar]
  75. González-Megías, A.; Menendez, R.; Roy, D.; Brereton, T.; Thomas, C.D. Changes in the composition of British butterfly assemblages over two decades. Glob. Change Biol. 2008, 14, 1464–1474. [Google Scholar] [CrossRef]
  76. Dos Santos, A.S.; Saraiva, D.D.; Müller, S.C.; Overbeck, G.E. Interactive effects of environmental filtering predict beta-diversity patterns in a subtropical forest metacommunity. Perspect. Plant Ecol. Evol. Syst. 2015, 17, 96–106. [Google Scholar] [CrossRef]
  77. Hamid, M.; Khuroo, A.A.; Charles, B.; Ahmad, R.; Singh, C.P.; Aravind, N.A. Impact of climate change on the distribution range and niche dynamics of Himalayan birch, a typical treeline species in Himalayas. Biodivers. Conserv. 2019, 28, 2345–2370. [Google Scholar] [CrossRef]
  78. Liang, M.; Baiser, B.; Hallett, L.M.; Hautier, Y.; Jiang, L.; Loreau, M.; Record, S.; Sokol, E.R.; Zarnetske, P.L. Consistent stabilizing effects of plant diversity across spatial scales and climatic gradients. Nat. Ecol. Evol. 2022, 6, 1669–1675. [Google Scholar] [CrossRef] [PubMed]
  79. Levine, J.M.; Bascompte, J.; Adler, P.B.; Allesina, S. Beyond pairwise mechanisms of species coexistence in complex communities. Nature 2017, 546, 56–64. [Google Scholar] [CrossRef] [PubMed] [Green Version]
  80. Chai, Y.; Yue, M.; Liu, X.; Guo, Y.; Wang, M.; Xu, J.; Zhang, C.; Chen, Y.; Zhang, L. Patterns of taxonomic, phylogenetic diversity during a long-term succession of forest on the Loess Plateau, China: Insights into assembly process. Sci. Rep. 2016, 6, 27087. [Google Scholar] [CrossRef] [PubMed] [Green Version]
  81. Xing, D.; He, F. Environmental filtering explains a U-shape latitudinal pattern in regional β-deviation for eastern North American trees. Ecol. Lett. 2019, 22, 284–291. [Google Scholar] [CrossRef]
  82. Tao, Y.; Zhou, X.B.; Zhang, S.H.; Lu, H.Y.; Shao, H. Soil nutrient stoichiometry on linear sand dunes from a temperate desert in Central Asia. Catena 2020, 195, 104847. [Google Scholar] [CrossRef]
  83. Feng, J.; He, K.; Zhang, Q.; Han, M.; Zhu, B. Changes in plant inputs alter soil carbon and microbial communities in forest ecosystems. Glob. Change Biol. 2022, 28, 3426–3440. [Google Scholar] [CrossRef]
  84. Wang, Z.F.; Zheng, F.L. C, N, and P stoichiometric characteristics of Pinus tabulaeformis plantation in the Ziwuling Region of the Loess Plateau. Acta Ecol. Sin. 2018, 38, 6870–6880. [Google Scholar] [CrossRef]
  85. Chen, X.; Feng, J.; Ding, Z.; Tang, M.; Zhu, B. Changes in soil total, microbial and enzymatic CNP contents and stoichiometry with depth and latitude in forest ecosystems. Sci. Total Environ. 2022, 816, 151583. [Google Scholar] [CrossRef]
  86. Tang, B.; Rocci, K.S.; Lehmann, A.; Rillig, M.C. Nitrogen increases soil organic carbon accrual and alters its functionality. Glob. Change Biol. 2023, 25, 2325–2337. [Google Scholar] [CrossRef]
  87. Niu, S.; Song, L.; Wang, J.; Luo, Y.; Yu, G. Dynamic carbon-nitrogen coupling under global change. Sci. China Life Sci. 2023, 1–12. [Google Scholar] [CrossRef]
  88. Guiz, J.; Ebeling, A.; Eisenhauer, N.; Hacker, N.; Hertzog, L.; Oelmann, Y.; Roscher, C.; Wagg, C.; Hillebrand, H. Interspecific competition alters leaf stoichiometry in 20 grassland species. Oikos 2018, 127, 903–914. [Google Scholar] [CrossRef]
  89. Finegan, B. Forest succession. Nature 1984, 312, 109–114. [Google Scholar] [CrossRef]
  90. Furey, G.N.; Tilman, D. Plant biodiversity and the regeneration of soil fertility. Proc. Natl. Acad. Sci. USA 2021, 118, e2111321118. [Google Scholar] [CrossRef]
  91. Huang, L.; Hu, H.; Bao, W.; Hu, B.; Liu, J.; Li, F. Shifting soil nutrient stoichiometry with soil of variable rock fragment contents and different vegetation types. Catena 2023, 220, 106717. [Google Scholar] [CrossRef]
  92. Weidlich, E.W.; Von Gillhaussen, P.; Delory, B.M.; Blossfeld, S.; Poorter, H.; Temperton, V.M. The importance of being first: Exploring priority and diversity effects in a grassland field experiment. Front. Plant Sci. 2017, 7, 2008. [Google Scholar] [CrossRef] [PubMed] [Green Version]
  93. Grainger, T.N.; Letten, A.D.; Gilbert, B.; Fukami, T. Applying modern coexistence theory to priority effects. Proc. Natl. Acad. Sci. USA 2019, 116, 6205–6210. [Google Scholar] [CrossRef] [Green Version]
  94. Cattelino, P.J.; Noble, I.R.; Slatyer, R.O.; Kessell, S.R. Predicting the multiple pathways of plant succession. Environ. Manag. 1979, 3, 41–50. [Google Scholar] [CrossRef]
  95. Villa, P.M.; Martins, S.V.; Diniz, É.S.; de Oliveira Neto, S.N.; Neri, A.V.; Pinto, H., Jr.; Nunes, J.A.; Bueno, M.L.; Ali, A. Taxonomic and functional beta diversity of woody communities along Amazon Forest succession: The relative importance of stand age, soil properties and spatial factor. For. Ecol. Manag. 2021, 482, 118885. [Google Scholar] [CrossRef]
  96. Zhang, M.; Liu, B.; Li, G.; Kuang, Y.; Yue, X.; Jiang, S.; Liu, J.; Wang, L. The relative and combined effects of herbivore assemblage and soil nitrogen on plant diversity. Sci. China Life Sci. 2022, 65, 830–837. [Google Scholar] [CrossRef]
  97. Rosindell, J.; Hubbell, S.P.; He, F.; Harmon, L.J.; Etienne, R.S. The case for ecological neutral theory. Trends Ecol. Evol. 2012, 27, 203–208. [Google Scholar] [CrossRef]
  98. Yan, X.; Levine, J.M.; Kandlikar, G.S. A quantitative synthesis of soil microbial effects on plant species coexistence. Proc. Natl. Acad. Sci. USA 2022, 119, e2122088119. [Google Scholar] [CrossRef] [PubMed]
  99. Zobel, K. On the species-pool hypothesis and on the quasi-neutral concept of plant community diversity. Folia Geobot. 2001, 36, 3–8. [Google Scholar] [CrossRef]
  100. Jetz, W.; Rahbek, C.; Colwell, R.K. The coincidence of rarity and richness and the potential signature of history in centres of endemism. Ecol. Lett. 2004, 7, 1180–1191. [Google Scholar] [CrossRef]
  101. McGill, B.J. Matters of scale. Science 2010, 328, 575–576. [Google Scholar] [CrossRef] [Green Version]
  102. Yao, S.; Qin, J.; Peng, X.; Zhang, B. The effects of vegetation on restoration of physical stability of a severely degraded soil in China. Ecol. Eng. 2009, 35, 723–734. [Google Scholar] [CrossRef]
  103. Kou, M. The Characteristics of Erosion-Resistant Plant and Its Community in the Hill and Gully Loess Plateau Region; Research Center of Soil and Water Conservation and Ecological Environment, Chinese Academy of Sciences and Ministry of Education: Beijing, China, 2016. (In Chinese) [Google Scholar]
Figure 1. Different stages of vegetation restoration at the Ziwuling research site on China’s Loess Plateau. (a) Ziwuling research site location; (b) Successional sequence of vegetation restoration.
Forests 14 00553 g001
Figure 2. Venn diagram of the different stages of vegetation restoration. Each circle represents a collection of species at one stage. The numbers outside the circles are the corresponding vegetation restoration periods (in years). The red font inside the circles indicates the total number of endemic plants at each stage (T-SS). Endemic plants occur in one stage only. The black numbers in the circles indicate the plants common to the corresponding stages.
Forests 14 00553 g002
Figure 3. Trends in β-diversity of plant communities and endemic plants in different periods. (a) Trends in the Bray-Curtis dissimilarity index of plant communities with vegetation restoration; (b) Trends in beta diversity index of the mean pairwise phylogenetic distance (Beta-mpd) of plant community with vegetation restoration; (c) Trends in beta diversity index of the mean nearest taxon phylogenetic distance (Beta-mntd) of plant community with vegetation restoration; (d) Trends in the endemic plants at each stage with vegetation restoration; **—p < 0.01; *—p < 0.05. Endemic plants occur in one stage only. “Total” represents the overall plant level of the investigated plant communities. “Herb” represents the herb plant level in the investigated plant communities. “Woody” represents the woody plant level in the investigated plant communities.
Forests 14 00553 g003
Figure 4. Soil C:N:P stoichiometry characteristics among the different periods. Different lowercase letters (a, b, c, d, e, and f) indicate significant differences (p < 0.05) within each variable among the different restoration periods.
Forests 14 00553 g004
Figure 5. The Mantel test on the relationship between plant community β-diversity ((a), the Bray-Curtis dissimilarity index; (b), beta diversity index of the mean pairwise phylogenetic distance; (c), beta diversity index of the mean nearest taxon phylogenetic distance) and soil C:N:P stoichiometry, TVR, and SS. ***—p < 0.001; **—p < 0.01; *—p < 0.05. TVR indicates the time after vegetation restoration (in years). SS indicates endemic plants at each stage; endemic plants occur in one stage only. “Total or T” represents the overall plant level of the investigated plant communities; “Herb or H” represents the herb plant level in the investigated plant communities; and “Woody or W” represents the woody plant level in the investigated plant communities.
Forests 14 00553 g005
Figure 6. The redundancy analysis on the relationship between plant community β-diversity and soil C:N:P stoichiometry, TVR, and SS. TVR indicates the time after vegetation restoration (in years). SS indicates endemic plants at each stage. “Total or T” represents the overall plant level of the investigated plant communities. “Herb or H” represents the herb plant level in the investigated plant communities. “Woody or W” represents the woody plant level in the investigated plant communities.
Forests 14 00553 g006
Disclaimer/Publisher’s Note: The statements, opinions and data contained in all publications are solely those of the individual author(s) and contributor(s) and not of MDPI and/or the editor(s). MDPI and/or the editor(s) disclaim responsibility for any injury to people or property resulting from any ideas, methods, instructions or products referred to in the content.

